


The listing made $98,910 whichever way the ads were split. One spreadsheet allocation turned the kids' tumbler from profitable to unprofitable, in a four-size Amazon listing. The figures are an example; the mechanics are how the allocation really works. A SKU's margin after ads should flag a size for review; it should never decide the cut on its own.
Gross margin is what is left of a sale after the cost of the product itself; contribution margin is what is left after every cost that moves with that sale, including marketplace fees, fulfillment, the cost of returns and ad spend. The first tells you whether a product is priced well against what it costs to make, and the second whether one more sale puts money in the bank.
Gross margin vs contribution margin: the two formulas
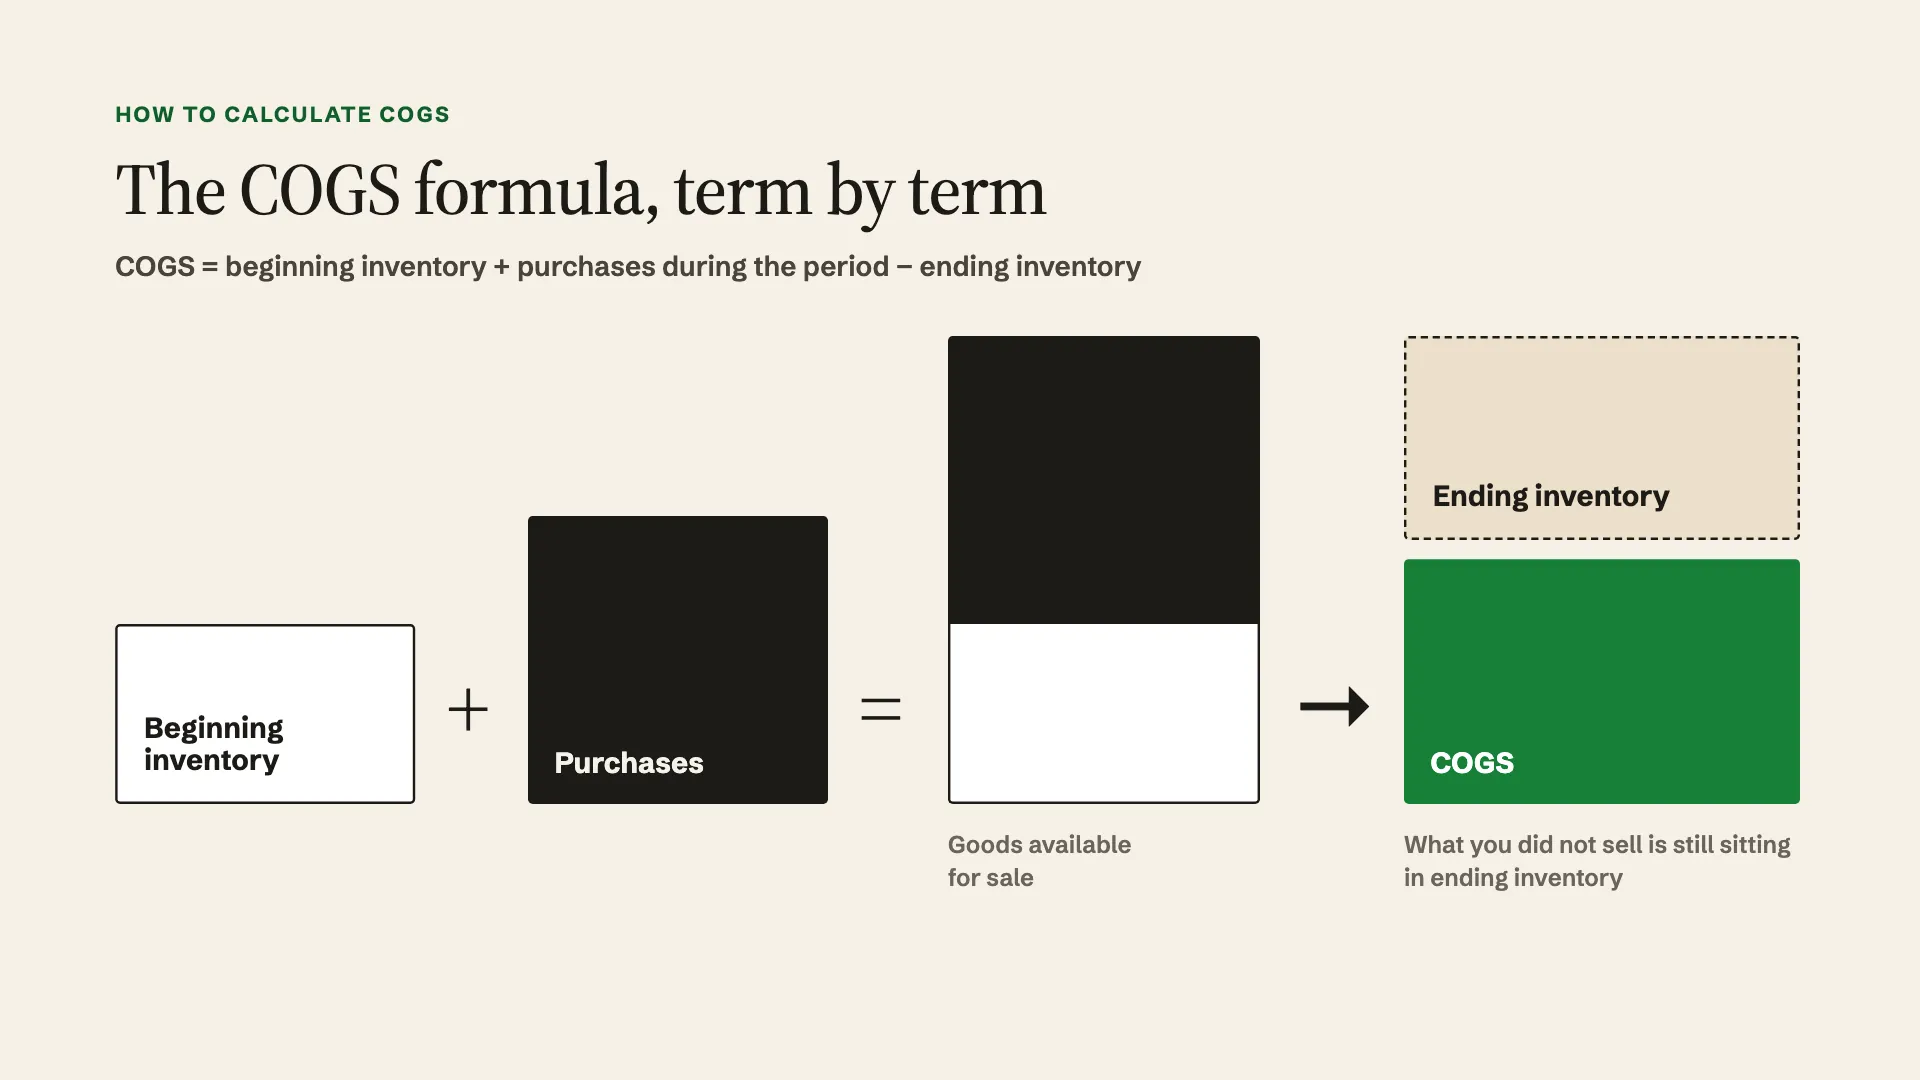
Gross margin is net sales minus cost of goods sold, divided by net sales. For a brand that imports finished goods, COGS is the landed cost of each unit: the product, inbound freight and duty. Some brands also put fulfillment into COGS, a defensible choice if it is made once and kept; the formula is in how to calculate COGS.
Contribution margin is net sales minus every variable cost, divided by net sales. On a marketplace or a Shopify store, the variable costs are COGS, referral or payment processing fees, fulfillment and shipping, the cost of returns, and advertising. What remains is the money each sale contributes toward rent, salaries, software and profit.
Returns hit three places on the books: the refund, the unit that cannot be resold and the return fee. The example below rolls all three into one returns allowance per unit, so the margin per sale is not overstated.
| Gross margin | Contribution margin | |
|---|---|---|
| Subtracts | Landed product cost | Landed cost, fees, fulfillment, returns allowance, ads |
| Answers | Is the product priced well against its cost? | Does one more sale make money? |
| Where it lives | The income statement | A management report the brand builds |
| Moves when | Supplier price, freight or duty changes | Any of those, plus fee changes and ad spend |
Some finance teams number the layers CM1 to CM3, as the ecommerce P&L template does; the layer that matters for a keep-or-kill decision is the last one.
Accounting textbooks sometimes leave advertising out of contribution margin because it is not strictly variable. For a brand selling on Amazon, that distinction rarely holds up. Many sellers treat ad spend as part of the cost of the unit, because a listing that stops advertising often stops selling, and the analysis below follows them.
The example: one tumbler listing, four sizes
The example company is an Amazon-led drinkware brand whose insulated tumbler sells as one parent listing with four sizes: 40oz, 30oz, 20oz and a kids 12oz. Its figures are illustrative, not benchmarks.
The referral fee is an illustrative 15 percent and the fulfillment fees are illustrative too. Amazon publishes its current referral and FBA fees on its selling fees page, and each child should be priced from its own category rate and size tier, since a 12oz and a 40oz tumbler can fall into different fulfillment tiers.
| Per unit | 40oz | 30oz | 20oz | Kids 12oz |
|---|---|---|---|---|
| Price | $34.99 | $29.99 | $24.99 | $19.99 |
| Referral fee (15%) | $5.25 | $4.50 | $3.75 | $3.00 |
| FBA fee | $6.20 | $5.60 | $5.00 | $4.50 |
| COGS (product, freight, duty) | $10.50 | $9.20 | $8.30 | $7.50 |
| Returns allowance | $0.70 | $0.60 | $0.50 | $0.40 |
| Left before ads | $12.34 | $10.09 | $7.44 | $4.59 |
| Gross margin | 70.0% | 69.3% | 66.8% | 62.5% |
| Contribution before ads | 35.3% | 33.6% | 29.8% | 23.0% |
On gross margin alone, every size looks like a good product, and the spread from best to worst is seven and a half points. Once fees, fulfillment and returns come out, the picture changes. The kids size keeps $4.59 of a $19.99 sale while the 40oz keeps $12.34, and the kids size's margin falls from 62.5 percent to 23.0 percent. Small items carry fixed-dollar fees on a lower price, so they lose more of each sale to them.
This example leaves out monthly storage, inbound placement, coupons and deal fees, which an Amazon seller should add for each child; for a small, slow size they can be the difference between a thin margin and a loss.
At monthly volumes of 6,000, 3,000, 1,200 and 800 units, the listing contributes about $117,000 a month before ads under these assumptions, $116,910 exactly: $74,040 from the 40oz, $30,270 from the 30oz, $8,928 from the 20oz and $3,672 from the kids size.
How splitting ad spend across SKUs can flip the decision
The company spends $18,000 a month on Sponsored Products for this listing, about 5 percent of its sales, which is light for a category this crowded; in this example most sales come from organic rank built over years. Amazon reports Sponsored Products spend against the child you advertise, but shoppers who click an ad for one size often buy another, and Sponsored Brands spend is reported by campaign, not by size. So the spend Amazon shows for each size does not match the sales it bought, and someone has to decide how the $18,000 is shared. Three methods are common: keep Amazon's per-child spend as reported, split it by units sold, or split it evenly across the children. Spend as reported usually overloads the hero size the brand advertises most; in this example Amazon shows $13,500 against the 40oz.
| Monthly, after ads | 40oz | 30oz | 20oz | Kids 12oz | Listing total |
|---|---|---|---|---|---|
| Ad cost, as Amazon reports it | $13,500 | $3,000 | $900 | $600 | $18,000 |
| Contribution, as reported | $60,540 | $27,270 | $8,028 | $3,072 | $98,910 |
| Ad cost, by units sold | $9,818 | $4,909 | $1,964 | $1,309 | $18,000 |
| Contribution, by units sold | $64,222 | $25,361 | $6,964 | $2,363 | $98,910 |
| Ad cost, even split | $4,500 | $4,500 | $4,500 | $4,500 | $18,000 |
| Contribution, even split | $69,540 | $25,770 | $4,428 | −$828 | $98,910 |
As reported, the kids size carries $0.75 of advertising per unit and keeps $3.84. Split by units, ads cost $1.64 on every tumbler, and the kids size keeps $2.95 a unit. Split evenly, the kids size carries $5.63 of advertising per unit and loses $1.04 on each one. The same product is a keeper under two methods and a candidate to cut under the third.
The listing made $98,910 every time.
Nothing about the business changed between the three versions, only the story about which size earned the money. The 40oz ranges from $60,540 to $69,540 a month depending on the method, and the kids size from a $828 loss to a $3,072 profit. Many profit-per-product views compute this at the parent level, or use each child's attributed ad sales, and never show the choice being made. For a catalog built on variations, that choice often decides the outcome.
No method is right by default. If most of the budget bids on searches the 40oz wins, a units-based split is closer to what the spend bought. If a separate ad group targets kids' searches, that budget belongs to the kids size whatever its volume. Pick one method and write it down so the months compare, but remember it is a choice. The number it produces can tell you where to look; it cannot tell you what to cut.
A rule for cutting a SKU
An allocated margin can put a size on the review list. It cannot make the cut, because the allocation is a choice. The decision rests on two questions: which costs actually go away if you stop stocking the size, and which of its sales move to another size and which leave.
Work it through for the kids' tumbler. Its 800 units a month keep $3,672 before ads, and the fees, fulfillment, cost of goods and returns behind that figure all stop with the size. The ad cost that stops is neither the $4,500 of the even split nor the $600 Amazon reports; it is whatever spend you would actually switch off. If the kids' size has no ad group of its own and the listing keeps its $18,000 budget, almost none stops, and dropping the size gives up as much as $3,672 a month. Some of those buyers would pick the 20oz instead. If a quarter of them do, 200 more 20oz units keep $7.44 each, or $1,488, and the net loss is $2,184 a month under these assumptions, before any ad spend that stops. The quarter is a guess, and a brand rarely knows its switch rate until the size is gone. Either way, the cut pays only if the spend that truly stops, plus any storage or deal fees the example leaves out, is larger than the contribution that leaves.
- Record the allocation method so months compare, and flag a size after three consecutive months below zero after ads under it.
- Count what stops with the size: its fees, fulfillment, cost of goods and returns, plus only the ad spend you would switch off.
- Estimate which of its sales move to another size and what the size does for the listing. From February 2026 Amazon began narrowing review sharing across variations to variations with minor differences, such as sizes that keep the same function, so check whether a size still pools the listing's reviews before counting on it. A size that holds search rank or ships inside a bundle has to be judged with the rest of the listing.
- Try the price and the ad targeting first, since both are faster to change than the catalog.
- Decide what happens to the stock already bought: sell it through at a lower bid, mark it down, or pull it out of FBA. Stop the next purchase order first, because that is where the cash is saved.
Building the per-SKU sheet itself is covered in product profitability analysis.
The same tumbler on two channels
Contribution margin also separates channels that gross margin cannot tell apart. The 40oz has the same 70.0 percent gross margin on Amazon and on the brand's Shopify store, if fulfillment sits below gross profit, because the tumbler costs the same to make wherever it sells.
The variable costs are different. On Shopify, take an illustrative $1.31 of payment processing, $10.50 of 3PL pick, pack and shipping, the same $10.50 of COGS and $0.70 of returns. That leaves $11.98 before ads, a little less than the $12.34 on Amazon even with no referral fee, because shipping a boxed 40oz tumbler costs the store more than Amazon charges to fulfill it. Suppose the store's Meta spend works out to $9.00 an order. After ads, the Shopify sale keeps $2.98, while the Amazon sale keeps $10.70 under the units-based split.
So the channel with no referral fee keeps less than a third as much per unit once shipping and advertising are counted. This assumes one tumbler per store order. If the average order carries 1.5 units, the shipping and ad cost per tumbler fall by a third, and the gap narrows. It is also a first-order view. If Shopify customers buy again and Amazon customers do not, the store's later orders carry little or no ad cost, and the comparison belongs in a lifetime view of unit economics. Contribution margin on the first order is still the right place to start, because it shows how much each channel's advertising has to earn back.
When gross margin is still the right number
Gross margin is the cleaner number for anything about the product itself. It shows whether a supplier price increase, a freight spike or a duty change has eaten into the product, without ad spend moving the result from month to month. It is what the income statement reports, what an accountant prepares and what a buyer of the business reads first. Importers who need the full per-unit landed cost will find it in the post on true landed cost per SKU.
Use gross margin to judge the product and the supplier. Use contribution margin to judge the listing, the channel and the advertising. And when a size looks like a loser, ask what stops and where its buyers go before trusting the split that made it look that way.
Frequently asked questions
What is the difference between contribution margin and gross margin?
Gross margin subtracts only the cost of goods sold from net sales, so it measures whether a product is priced well against what it costs to make. Contribution margin also subtracts marketplace fees, fulfillment, payment processing and advertising, and allows for the cost of returns, so it measures whether each extra sale adds money toward fixed costs and profit. A brand can have a strong gross margin and a weak contribution margin.
How should ad spend be split across Amazon variations?
There is no single correct method. The three common choices are keeping the spend Amazon reports for each child, splitting it by units sold, or splitting it evenly, and the choice alone can turn a profitable size into a losing one. Record one method so months compare, use it to flag sizes for review, and decide a cut on the costs that actually stop and the sales that move to other sizes.
Is contribution margin on the income statement?
No. The income statement reports gross profit and operating expenses, and the costs that make up contribution margin sit in several places on it, with advertising usually in operating expenses. Contribution margin is a management figure the brand builds from those lines, which is why it needs a consistent definition from month to month.