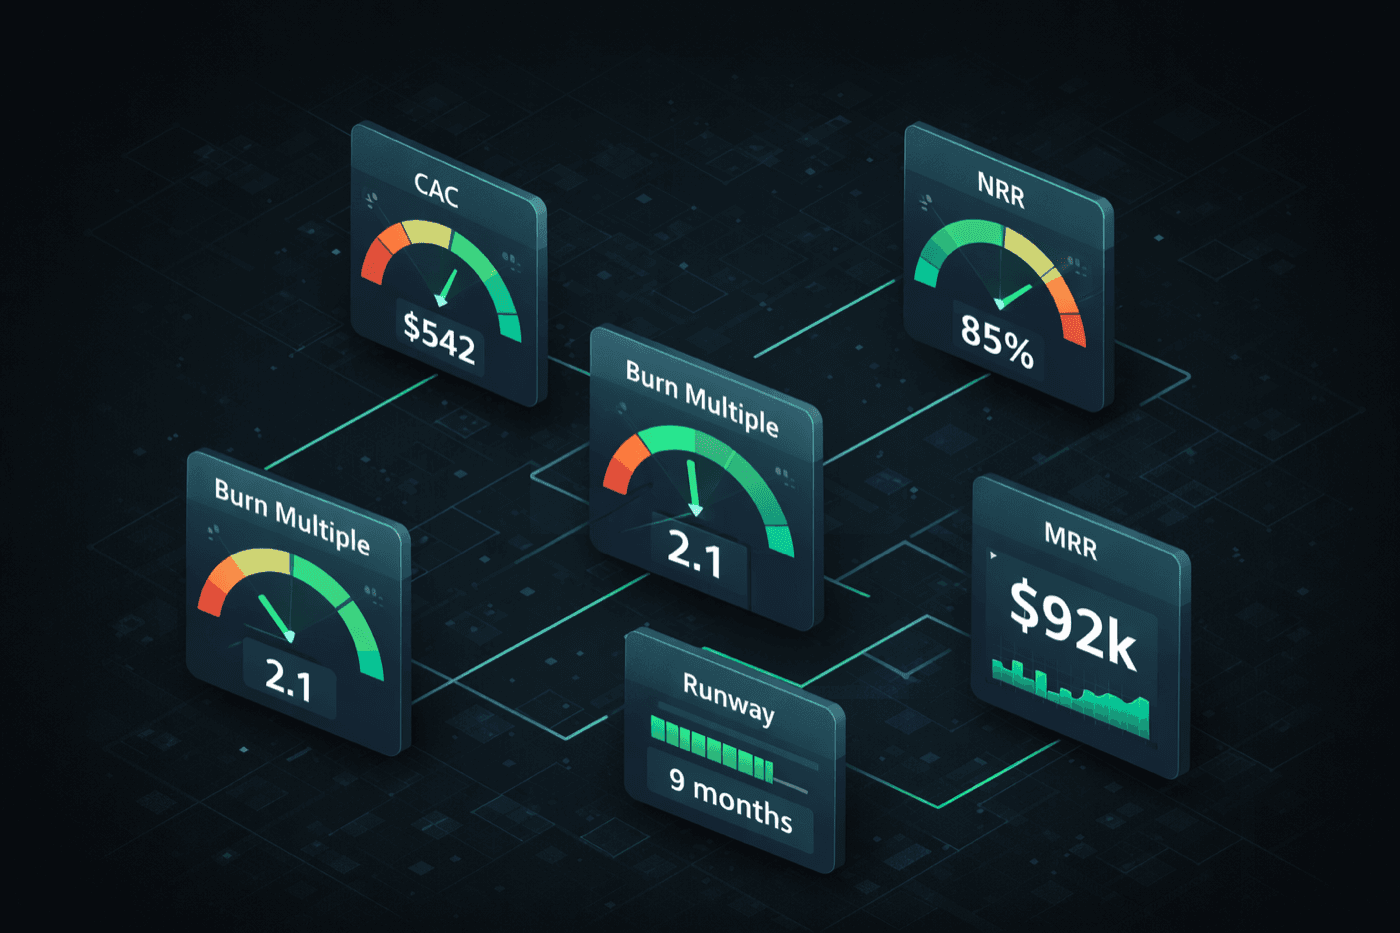
Most SaaS companies either track too many metrics or the wrong ones for their stage. A pre-revenue startup monitoring net revenue retention is measuring noise. A Series A company without a burn multiple calculation is missing what investors evaluate first.
The solution is a stage-appropriate metrics dashboard, one that scales in complexity as the business scales in maturity. This guide provides the specific KPIs to track at each stage, the benchmarks that define healthy performance, and the practical approaches for implementation.
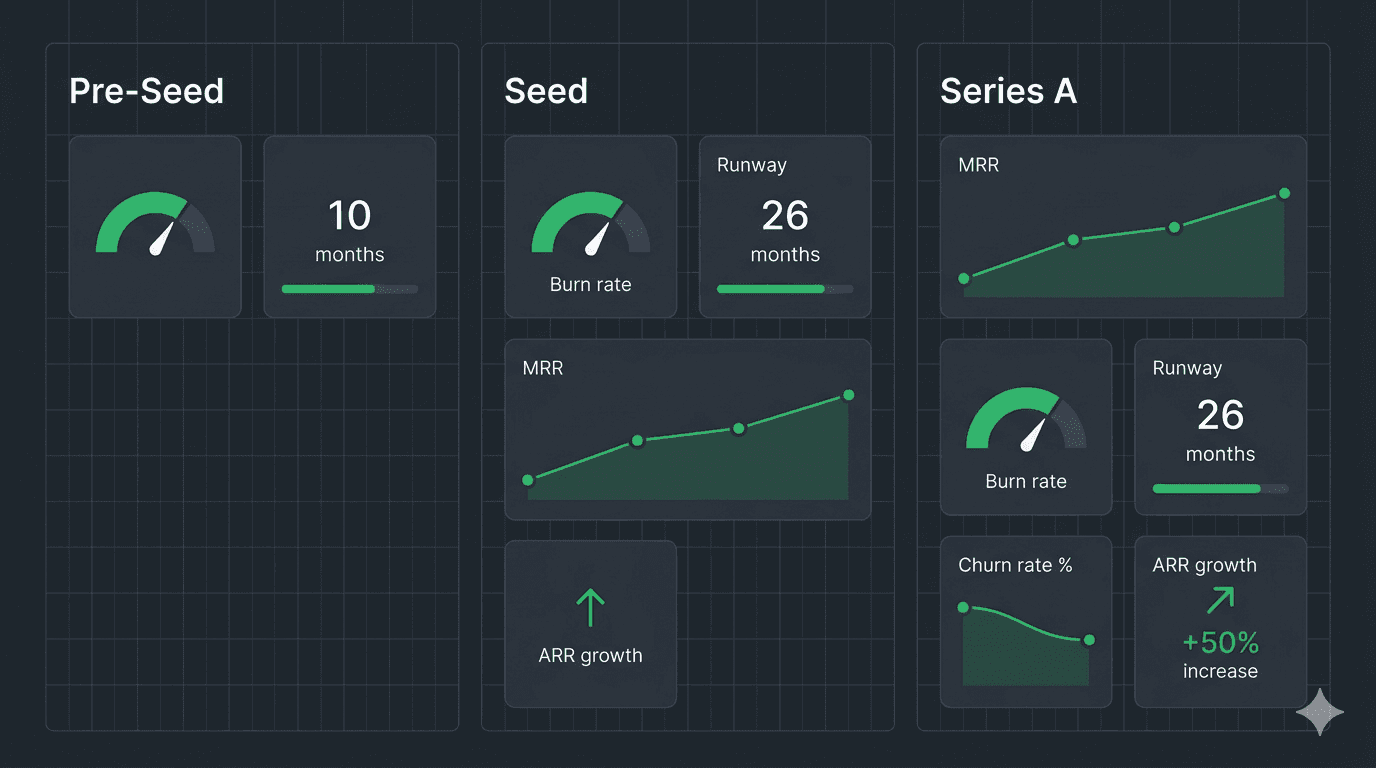
Pre-Seed / Pre-Revenue: The Survival Dashboard
At this stage, the business has no revenue or very early revenue. The dashboard should contain four metrics.
The 4 Essential Metrics
1. Burn Rate (Monthly)
Monthly cash outflow, reviewed weekly. At pre-revenue, gross burn and net burn are nearly identical. This is the single most important number for a pre-revenue company. Precision matters. The burn rate should be accurate within $1,000.
2. Runway (Months Remaining)
Cash in bank divided by monthly burn rate. Fundraising should begin when runway reaches 9-12 months. Below 6 months, negotiating leverage deteriorates significantly.
The percentage of new signups who complete the core value action. This is the earliest reliable signal of product-market fit. An activation rate below 20% indicates onboarding or product issues that should be resolved before investing in acquisition.
4. Weekly Active Users or Engagement
User engagement frequency, measured through DAU/MAU ratio or weekly active user counts. Consistent or growing engagement with a small user base is a stronger signal than rapid signup growth with poor retention.
What to Defer
CAC, LTV, and NRR require sufficient data volume to produce meaningful results. With fewer than 50 customers, these metrics are too noisy to act on. Treat that as a practical heuristic rather than a statistical law, but it holds: a single large customer churning can swing every one of these numbers.
Seed Stage ($10K–$100K MRR): The Unit Economics Dashboard
With paying customers established, the central question shifts from product viability to economic sustainability. The dashboard expands to seven metrics.
The 7 Essential Metrics
1. MRR and MRR Movements
Total MRR is the headline number, but the movement breakdown is more diagnostic: New MRR, Expansion MRR, Contraction MRR, and Churned MRR. A company adding $15K in new MRR while churning $12K has a net growth of $3K, a fundamentally different position than adding $15K with $3K in churn.
Net burn (expenses minus revenue) becomes the primary measure as revenue begins offsetting costs. The key trend to monitor: burn rate as a percentage of revenue should be declining month over month.
3. Churn Rate: Logo and Revenue
Both logo churn and revenue churn provide distinct signals. Monthly logo churn above 5% indicates a retention problem requiring immediate attention. Between 3-5% is within normal range for SMB SaaS. Below 3% indicates strong product stickiness.
4. CAC by Channel
Blended CAC is useful for high-level reporting. Channel-specific CAC is useful for decision-making. Organic and paid acquisition costs typically differ by 3-5x. Understanding this distribution drives budget allocation.
5. Gross Margin
SaaS gross margins should fall between 70-85%. Below 70% suggests infrastructure inefficiency or an outsized services component. Investors evaluate gross margin as an indicator of business model quality and scalability.
(New MRR + Expansion MRR) ÷ (Churned MRR + Contraction MRR). This single metric captures growth quality. A Quick Ratio above 4 indicates efficient growth. Below 2 indicates that churn is consuming a disproportionate share of new revenue.
Continued tracking from the pre-seed stage. The rate should improve as onboarding is refined. A flat or declining activation rate with increasing acquisition spend indicates a scaling problem.
Begin Monitoring
LTV and LTV:CAC ratio can be estimated with 6-12 months of customer data. Calculate quarterly rather than monthly to reduce noise from small sample sizes.
Series A ($100K+ MRR): The Investor-Ready Dashboard
At this stage, the metrics dashboard must support fundraising conversations and board reporting. It expands to include efficiency and retention metrics that Series A investors evaluate.
Add These Metrics to the Seed Dashboard
1. ARR and ARR Growth Rate
ARR replaces MRR as the primary revenue metric for investor communication. Year-over-year growth of 100%+ is the standard Series A benchmark. Net New ARR should be broken into its four components (new, expansion, contraction, churn) in every monthly report.
NRR is one of the strongest correlates of valuation multiples in public SaaS. Above 100% indicates existing customers are growing without new acquisition. Above 110% is considered strong. Above 120% is exceptional. Calculate on a trailing 12-month basis.
Track gross revenue retention alongside it. GRR is retention excluding expansion, so its ceiling is 100%, and it isolates how much of the base actually stays. Diligence teams ask for both, because a strong NRR can mask a weak GRR propped up by a handful of expanding accounts.
A quick worked example: a cohort starts the year at $100,000 MRR. Over the next twelve months it loses $8,000 to churn and $4,000 to contraction, and gains $22,000 from expansion. NRR = ($100,000 − $8,000 − $4,000 + $22,000) ÷ $100,000 = 110%. GRR = ($100,000 − $8,000 − $4,000) ÷ $100,000 = 88%.
With sufficient customer data, this becomes a core metric. The minimum benchmark is 3:1. Below 3:1 indicates unit economics that may not support scaled growth.
The number of months required to recover customer acquisition cost. Under 12 months is the target for most SaaS models. Above 18 months indicates capital-intensive growth that requires significant funding to sustain.
Net burn divided by net new ARR. Using David Sacks's tiers: under 1x is amazing, 1x to 1.5x is great, and 1.5x to 2x is acceptable but will draw questions. Above 3x signals that the company is spending disproportionately relative to revenue generation.
6. Rule of 40 Score
Revenue growth rate plus profit margin. The target is a combined score of 40 or above. Growth-stage companies typically index heavily on the growth component with negative margins. The trajectory matters more than the absolute score.
For companies with sales teams: weighted pipeline value divided by revenue target. Minimum coverage is 3x. This is the leading indicator that investors use to evaluate forward revenue predictability.
Board Reporting Format
These metrics should appear on page one of every board deck, presented with:
- Current period value
- 3-month trend (directional indicator)
- Variance against internal target
- Brief commentary on off-track metrics
One page. Detailed drill-downs should be available on request, not presented proactively.
Implementation Approaches
Spreadsheet (Free, Manual) Google Sheets with billing system exports. Sufficient at pre-seed. Becomes unsustainable at seed stage when real-time data and weekly updates are required.
BI Tool + Data Warehouse (Expensive, Complex) Metabase, Looker, or Tableau connected to a data warehouse. Powerful but requires dedicated engineering resources to build and maintain. Typically more infrastructure than seed-stage companies need.
Purpose-Built Financial Platform (Recommended) Futureproof connects directly to bank accounts and Stripe to calculate MRR movements, burn rate, runway, gross margin, and unit economics automatically. At $1,000/month flat for all six agents, it provides investor-ready metrics without requiring a finance team or engineering resources.
Guiding Principle
Effective metrics dashboards track fewer metrics with greater depth. Five well-understood KPIs will drive better decisions than fifty superficially monitored data points. The dashboard should evolve with the company, adding metrics when they become statistically meaningful and removing them when they are no longer actionable.
A metric that has not influenced a decision within the last 30 days should be evaluated for removal.
If you're tracking these metrics because a fundraise is on the horizon, take our free Startup Fundraising Scorecard to see how your overall readiness stacks up, across team, market, traction, financial clarity, and investor preparedness.