


Each channel has its own math
Amazon Seller Central shows one set of numbers. Your own store has another. eBay counts revenue differently again. You switch tabs all week and nothing reconciles to anything.

Amazon Seller Central shows one set of numbers. Your own store shows another. eBay counts revenue differently again, and nothing lines up. Futureproof is one ledger that replaces your accounting software, and Hugo builds the profit and loss statement across every channel from it, so the comparison you decide on is the real one.
One month, three channels
A multi-channel P&L is one profit and loss statement that combines revenue, fees, and costs from every channel you sell on, so profitability is read in one place instead of four dashboards. It settles only when the channels post into one ledger, which is why a spreadsheet stitched from exports never quite closes the question.
Amazon Seller Central shows one set of numbers. Your own store has another. eBay counts revenue differently again. You switch tabs all week and nothing reconciles to anything.
You have a feeling about which channels are working, and no way to prove it with numbers. So the expansion decision gets made on revenue alone, which is the one figure that says nothing about profit.
At close or at tax time you pull exports from every platform, match transactions, and hope the totals agree. It should not take a month to learn whether last year made money.
Setup is one sitting. After that the ledger is posted and the channel view recalculated every night, so the comparison is current on the morning you need to make the call.
Channels, your own store, bank accounts, and credit cards connect in one sitting. Revenue, fees, refunds, and payouts come in from each channel and land in one set of books.
Theo captures supplier bills, freight, duty, and tariffs per unit, so the cost of goods behind a marketplace sale is the same cost of goods behind a sale on your own store.
Revenue, cost, and contribution are recalculated on the posted ledger, then split channel by channel and down to product, so each channel carries the fees it caused.
Margo prices the next move, shifting budget toward the channel that pays back, against supplier terms, stock on hand, and cash. You approve, adjust, or decline.
Three questions an operator asks before shifting spend or opening a channel, each answered from the same books your statements come from.
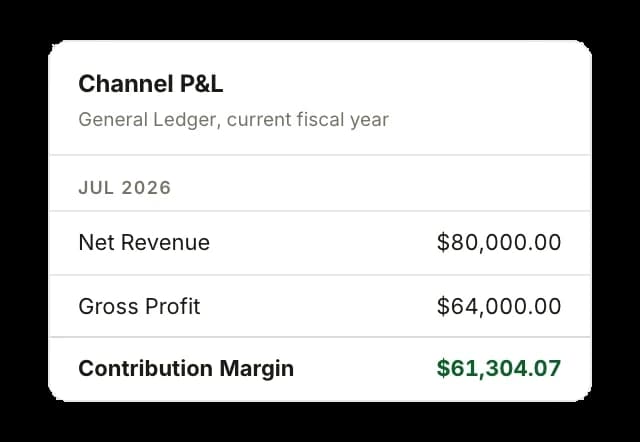
The channel statement steps down in layers. July reads $80,000.00 of net revenue, $64,000.00 of gross profit once landed cost comes out, and $61,304.07 of contribution once the selling and fulfillment costs that channel caused come out too. Reading the three together says whether a soft month came from price, from product cost, or from what the channel charged to sell.
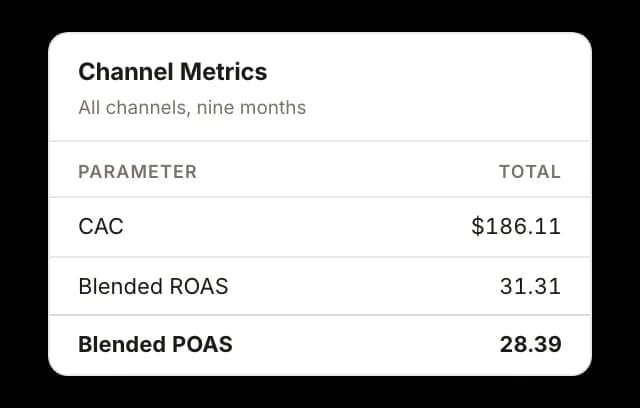
Acquisition cost, return on ad spend, and profit on ad spend are reported beside the orders they bought. Return on ad spend counts revenue, profit on ad spend counts what the revenue kept, and the distance between the two is how a channel can look like it is winning while it funds itself out of margin.
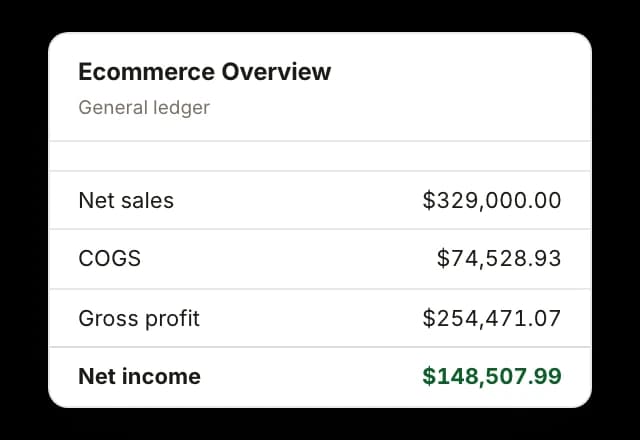
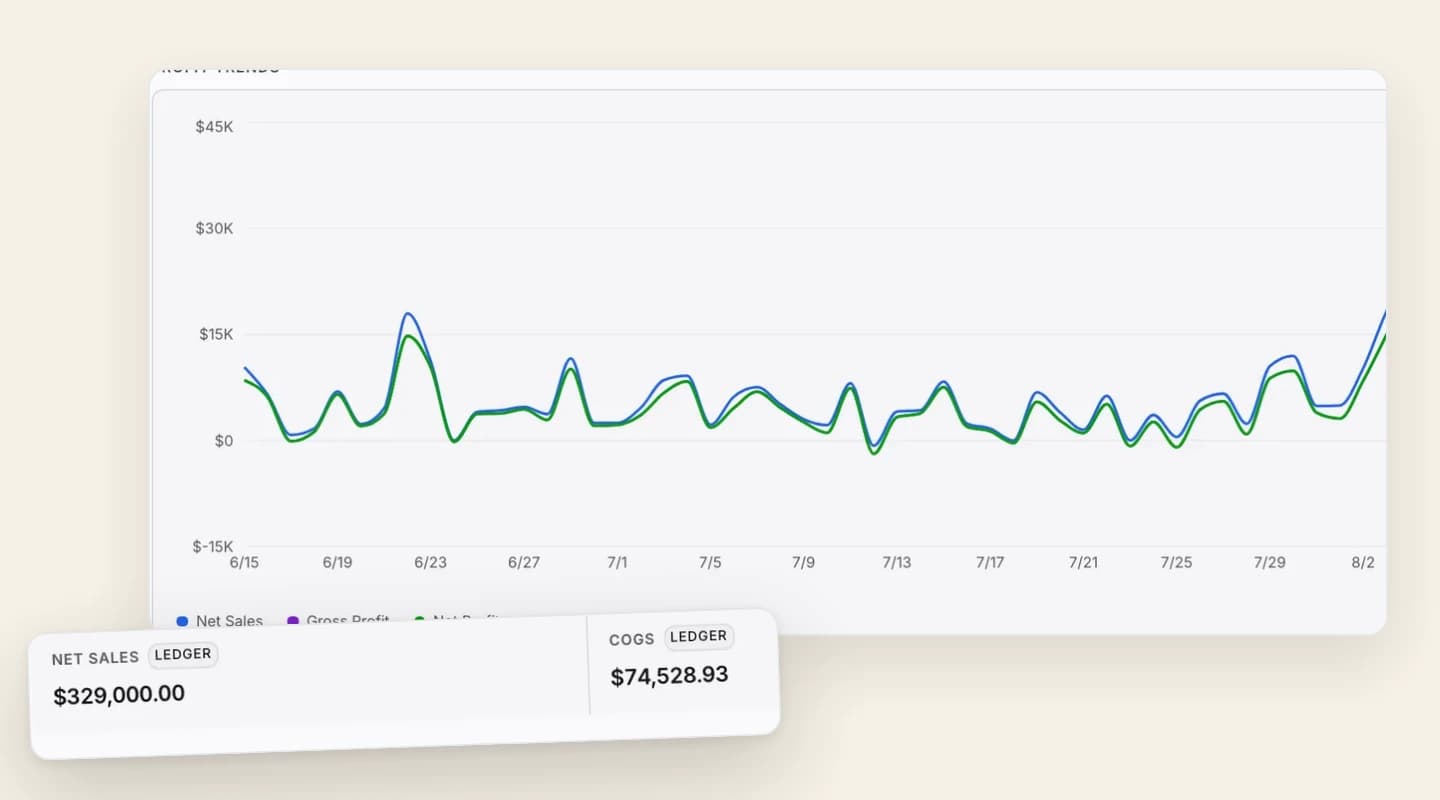
The summary at the top of the ecommerce view is read straight from the general ledger: net sales, cost of goods sold, gross profit, net income, each tagged as a ledger figure. It is the set your accountant closes and the set an acquirer would ask for, so the headline you manage by is not a second version of the year.

Vic splits each settlement into sales, fees, refunds, and adjustments, codes bank and card activity beside it, and closes the day, so every channel is posted to the same chart of accounts.

Hugo rebuilds revenue, cost, and contribution per channel and per product on the posted ledger, and decomposes a move into price, discount, refund, unit cost, fee, and volume.

Margo prices the shift in budget or the new channel against supplier terms, stock on hand, and your projected balance, and brings the number to you. The call stays yours.
The overview the ledger produces, the channel measures beside it, and the statement split month by month.
The overview opens on two rows of tiles. The first is the general ledger. The second is an operating view marked as a management read, because it carries manually entered expenses that never posted. Net sales run $329,000.00 on the ledger against $804,216.24 on the operating side, and that gap is labeled rather than blended away.
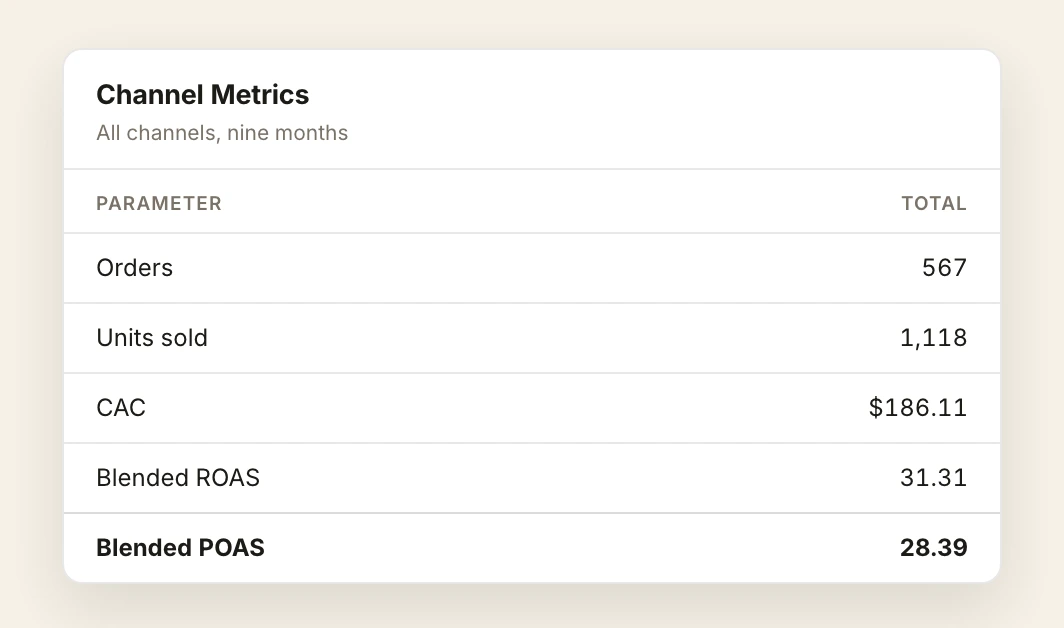
Orders, units sold, returns, average order value, acquisition cost, and return on ad spend are reported month by month and in total across all channels. Nine months of trading average out to $2,738.95 per order, so a strong revenue month can be read against what the orders cost to win.
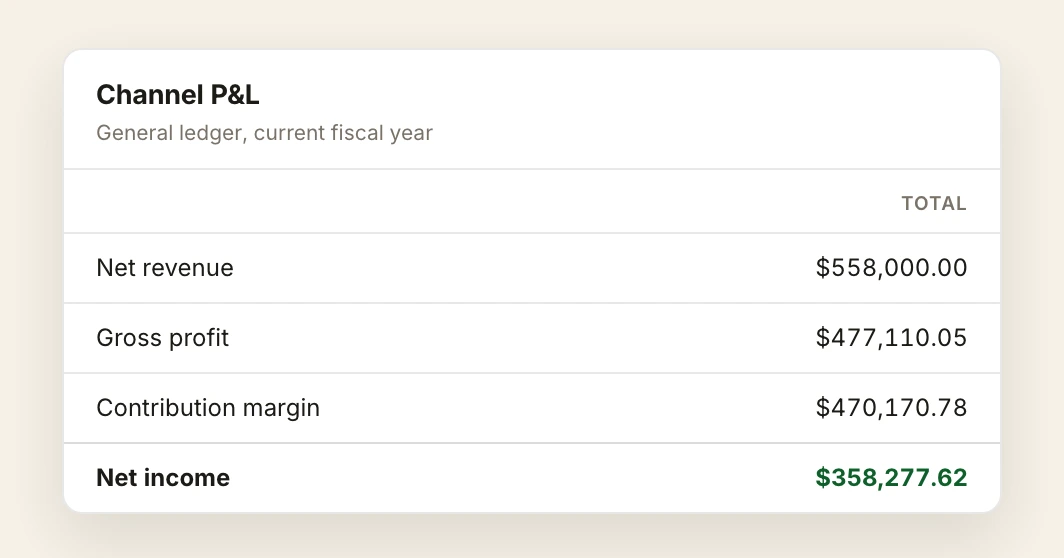
The channel statement runs the fiscal year across columns: revenue, selling and fulfillment, cost of goods sold, operating expenses, then net revenue, gross profit, and contribution margin. The year reads $558,000.00 of net revenue and $470,170.78 of contribution margin, and every row opens onto the entries underneath it.
A multi-channel P&L is a single profit and loss statement that combines revenue, costs, and fees from every channel you sell on, including Amazon, eBay, Shopify, and your own store, so you read total profitability in one place instead of checking each platform separately.
Amazon and eBay connect directly. Shopify is in beta, and TikTok Shop is coming soon. You can start on a 14-day trial and connect your channels in the first sitting.
Futureproof is one ledger that replaces your accounting software. Orders, fees, refunds, and payouts from each channel post into that ledger against a single chart of accounts, so the consolidated statement is not a stitched export. It is the books themselves, rebuilt nightly.
Yes. Revenue, landed cost of goods, channel fees, fulfillment, and the ad spend behind each channel are all coded to the channel that caused them, so contribution is reported per channel and per product from the same posted entries your financials come from.
Your numbers. Your answers. Smarter moves.
One profit and loss statement across Amazon, eBay, your own store, and the channels you add next, built from the ledger your financials come from.
Starting at $1,000/month for all six agents, with a monthly review call with a human financial specialist included. No per-seat fees, no modules.