


Spreadsheet models break
The model lives in a sheet with forty-seven tabs. One broken formula and the projection is wrong, and the evening goes into debugging a workbook instead of deciding anything with it.

A forecast is only as good as the actuals underneath it. Margo builds your operating model on the general ledger that is your system of record, so hiring plans, revenue assumptions, and expense drivers all sit on the same entries your statements come from. You set the assumptions. She keeps the arithmetic honest.
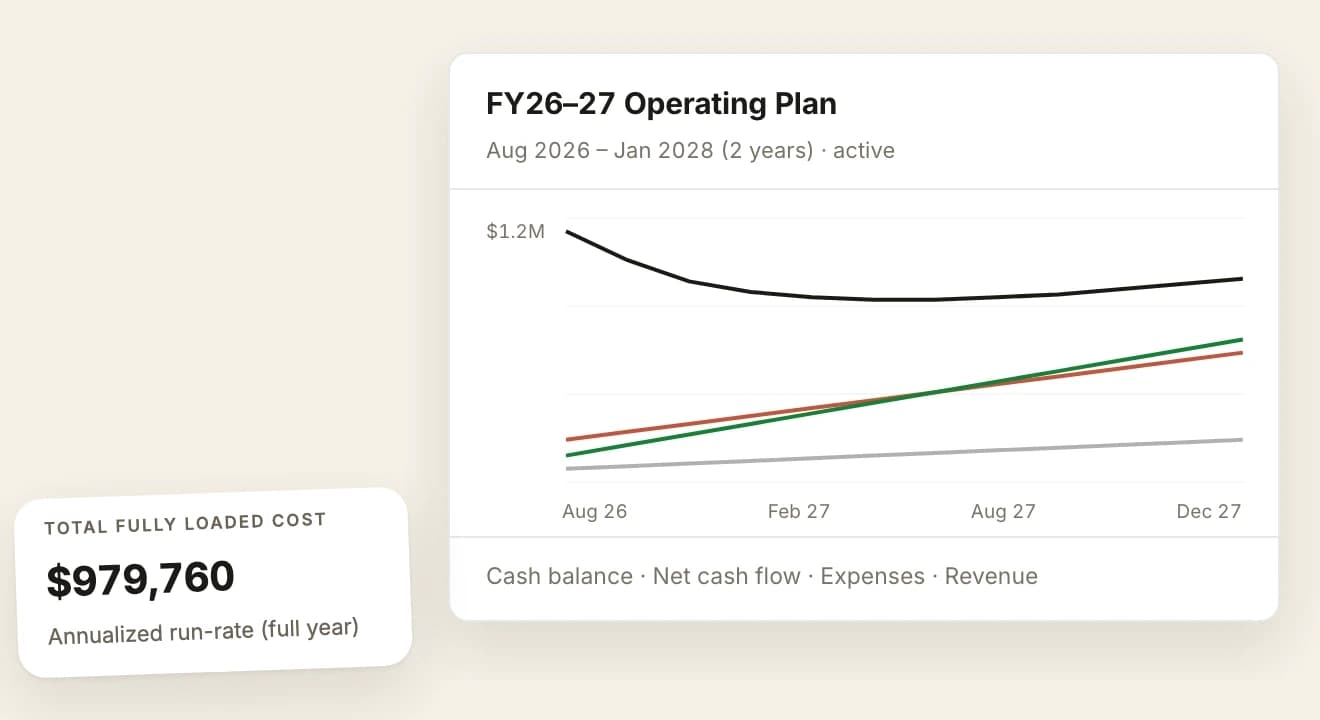
Financial planning for a startup is the work of turning a set of assumptions, who you hire, what you charge, what you spend, into a cash number you can decide against. It breaks when the assumptions live in one place and the actuals live in another, because then nobody can say which half of the plan was wrong.
The model lives in a sheet with forty-seven tabs. One broken formula and the projection is wrong, and the evening goes into debugging a workbook instead of deciding anything with it.
The plan is refreshed by hand once a month, and by the time the refresh is finished the numbers have moved again. Nothing connects what was planned to what happened, so the plan quietly stops being used.
Investors expect clean actuals against forecast. Pulling the numbers from three places means the story on the slide and the data behind it were assembled by different people on different days.
The model is not a separate artifact you maintain. It reads the ledger, so the actuals column fills itself and the only thing you own is the part that was always judgment.
Revenue, payroll, and operating costs reach the model from the ledger they were posted to. No export, no re-keying, no reconciliation between the plan and the books.
Growth assumptions, expense categories, and a hiring plan with salaries and start dates. Margo prices each one and shows what it does to the cash line.
Run a conservative, a base, and an aggressive case side by side, or two hiring plans against each other, and read the cash impact of each without rebuilding anything.
The version you approve is the one that feeds the board pack. Margo recalculates and flags variance; the plan that ships is the one you signed off.
Each answered on a surface you set yourself, so the number changes when the business does rather than when someone finds time to update a tab.
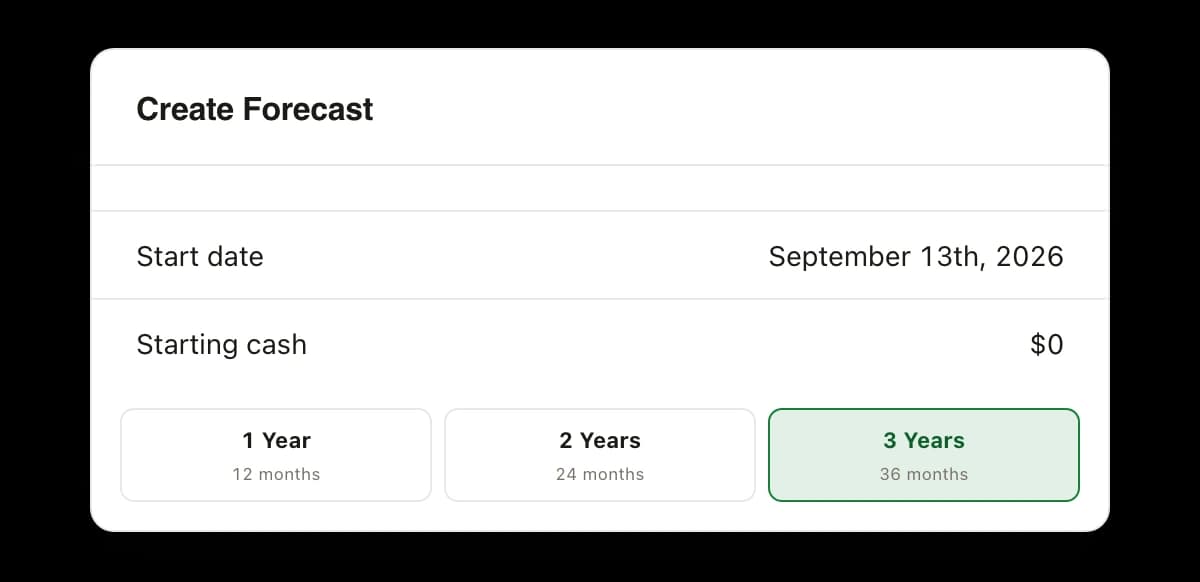
A plan is scoped before a single driver is set: a name, a start date, the cash it opens with, and a term of one year, two years or three, at twelve, twenty-four or thirty-six months. The horizon is a choice you make rather than a template you inherit.
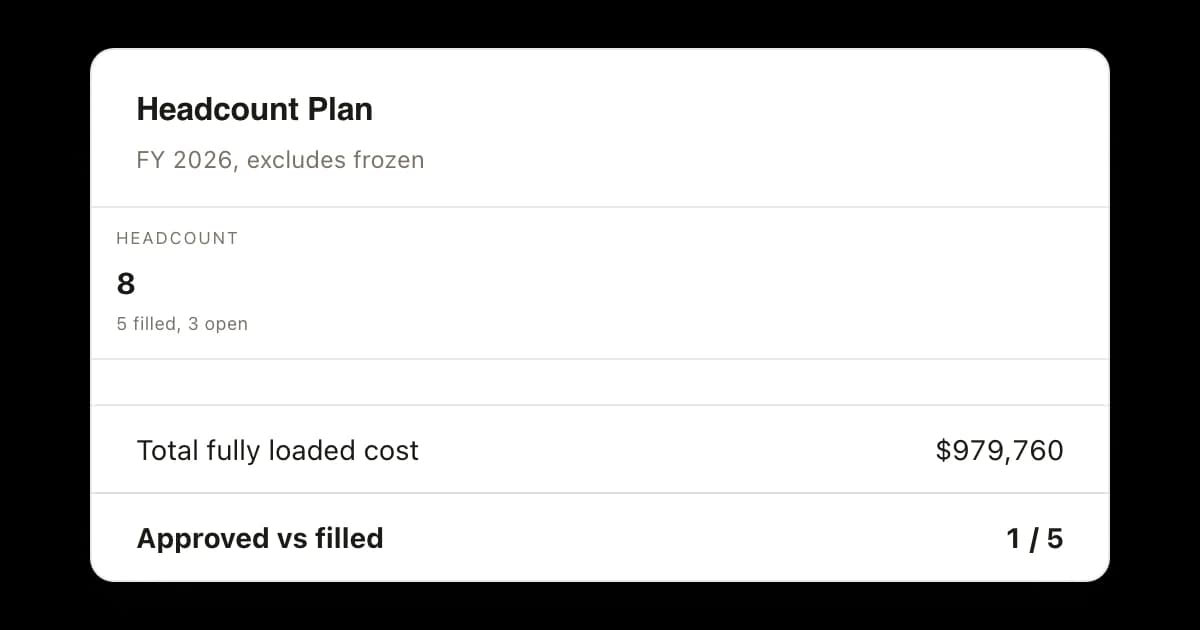
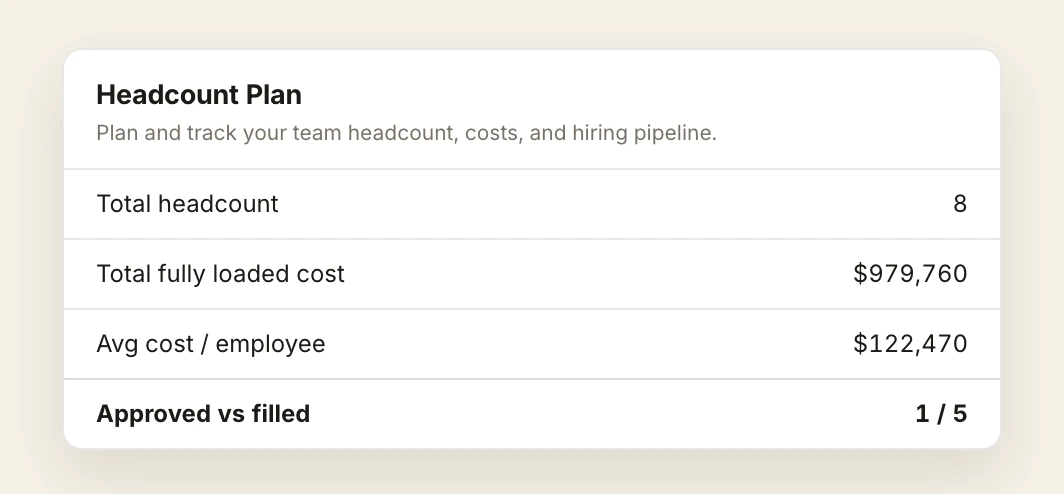
The hiring plan carries eight budgeted roles, five filled and three open, at $979,760 of fully loaded annual cost, with one of five approved roles filled. Roles enter the model as dated commitments with their own cost, not as a lump pasted into a row.
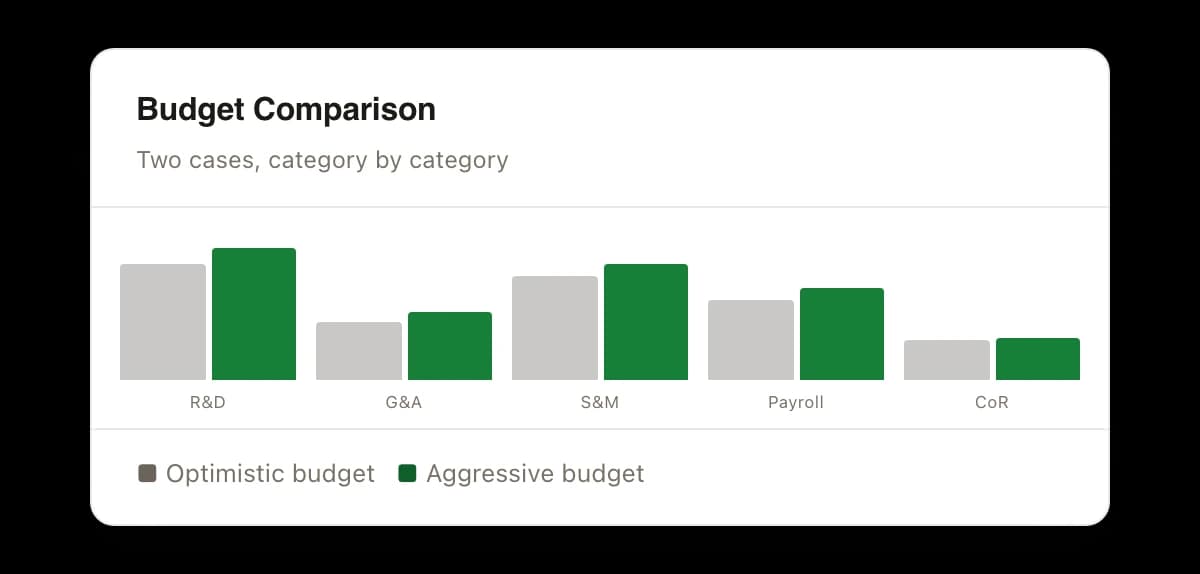
Two budget cases set beside one another, an optimistic one against an aggressive one, compared line by line across research and development, general and administrative, sales and marketing, payroll and cost of revenue. The gap between the two columns is the decision.

Margo builds the operating model on the ledger, prices every driver you set, compares scenarios against one another, and recalculates the cash line as actuals post.

Vic codes and reconciles the transactions the actuals column is made of, so plan against actual is a comparison between two things that were measured the same way.

Nia assembles the board deck from the approved plan and the posted numbers, as a PDF or a slide deck. You read it and approve it before anyone else does.
The loop first, then the grid the drivers live in and the plan that prices the people.
Five steps drawn as a circuit: actuals post, you set the drivers, scenarios are compared, a plan is approved, and variance comes back against the ledger it started on. A model that only runs forward has no fifth step, which is how it drifts.
The loop a plan has to close
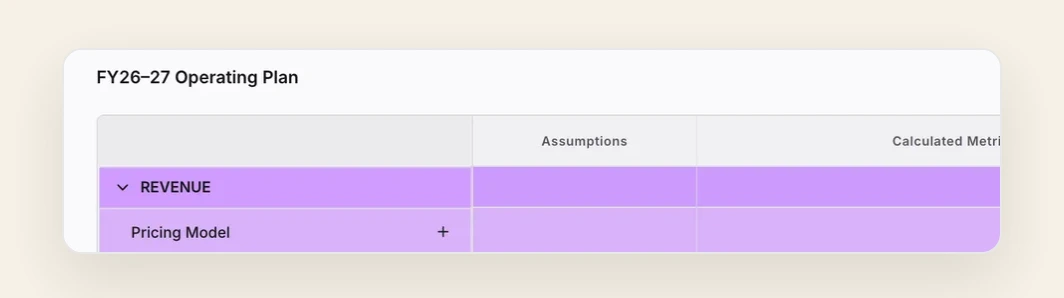
The chart sits over the grid it is drawn from. The plan is named across the top, an assumptions column runs beside a calculated metrics column, and the revenue group opens out to the driver underneath it, the pricing model. You fill the assumptions. The calculated metrics are what the model makes of them.
Under the summary tiles the plan charts monthly run-rate and cumulative spend across the fiscal year, and splits fully loaded annual cost by department, with research and development, sales and marketing, customer success, operations and general and administrative each carrying their own bar.
The model sits on the general ledger your books live in. Revenue, payroll, and operating costs reach it as actuals post, and you set the drivers on top: growth assumptions, expense categories, and a hiring plan with salaries and start dates. Margo recalculates the cash line as the actuals change.
Yes. Build scenarios with different hiring plans, growth rates, and expense assumptions, then compare them side by side to see what each one does to your cash position. Roles can be priced together rather than one at a time, which is the version of the question most founders are actually asking.
A standalone tool imports your numbers and models them somewhere else, so the plan and the books drift apart between refreshes. Futureproof is the ledger the actuals post to, so the forecast reads them directly. There is no import step and no reconciliation between the model and the accounts.
That is your call, and the two are not the same job. Futureproof does the modeling and the data work a finance team would otherwise do by hand, which is most of what a fractional CFO spends billable hours rebuilding. The strategy conversation stays a human one, and it starts from a much better place.
Your numbers. Your answers. Smarter moves.
Connect your accounts and the plan stops being a document you maintain. Set the assumptions, read the cash impact, and let the actuals meet the model on their own.
Starting at $1,000/month for all six agents, with a monthly review call with a human financial specialist included. No per-seat fees, no modules.