Revenue metrics · Hugo, channels

Revenue is the easy number. Net is the one that pays you.

Gross sales are what the channel reports. What reaches you is what survives discounts, refunds, referral and fulfillment fees, shipping, and cost of goods. Futureproof books each of those against the order that caused it in one ledger, so revenue by channel and by SKU is accounting-grade rather than estimated.

From gross sales to what you keep

  1. Gross sales
  2. Discounts
  3. Refunds
  4. Net sales
  5. Cost of goods
  6. Shipping and fulfillment
  7. Marketplace fees
  8. Gross profit before marketing
  9. Ad spend
  10. Gross profit

Read the same walk per channel, per brand, or per product.

The channel P&L walks one period down line by line, per channel and per product. On your account every step is your own posted entries, not an estimate laid over them.

Revenue is up.Margin is still a guess.

Ecommerce revenue metrics are the set of numbers that turn gross sales into what a brand actually keeps: net revenue after discounts and refunds, marketplace and fulfillment fees, cost of goods, and ad spend, read per channel and per SKU. Most brands see the top line daily and the rest of it a month later, in a spreadsheet nobody fully trusts.

Margin is too rough to act on

Referral fees, fulfillment charges, storage, shipping, returns, and cost of goods all come off the same order, and none of them arrive in the same report. Without the full picture per SKU and per channel, you cannot say which products deserve more budget.
Your winners get an even split

Revenue keeps growing and the bank balance does not keep pace. Because you cannot tell which SKUs actually pay back, the budget gets spread evenly, and your two real winners get the same spend as your eight middling ones.

Discounts hide in the top line

A promotion lifts units and the revenue chart looks healthy, so the discount reads as a success. What it cost per order, and whether the SKU still earned anything after fees and returns, is a separate question that usually goes unasked.

Every order is taken apart.Then put back together.

Setup is one sitting. After that each order is posted with the fees, refunds, and costs that belong to it, so the ranking you read in the morning is built from entries rather than estimates.

01

Connect

Sales channels, bank accounts, credit cards, and supplier bills connect in one sitting, so revenue and the costs that came off it land in the same ledger.

02

Orders and fees post

Overnight the agents work through it: payouts matched to the orders behind them, referral and fulfillment fees coded, refunds and discounts booked against the sale.

03

Hugo ranks the SKUs

Revenue, margin, and returns are reported per SKU and per channel, so the products carrying the business separate from the ones renting shelf space.

04

You move the budget

Hugo brings the ranking and the reasons under it. Where the ad money goes next is your call, and nothing is changed in an ad account on your behalf.

The questions margin turns on.Read straight off the ledger.

Three questions an operator asks before money moves between channels or SKUs, each answered from posted entries rather than a monthly rebuild.

Does the ad spend come back?

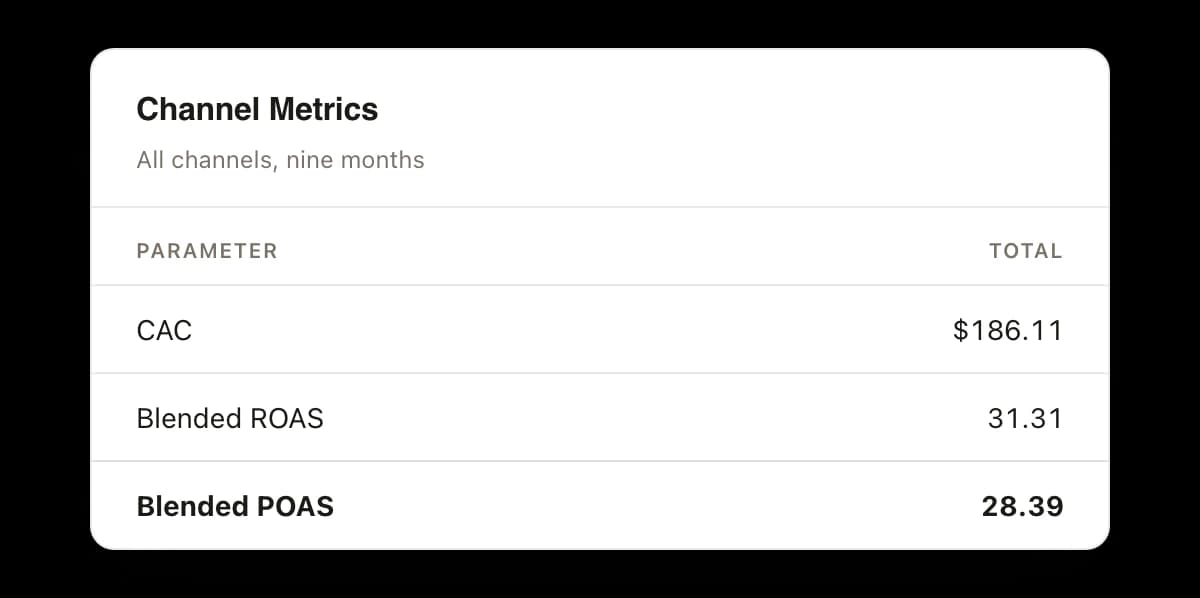
Acquisition cost and what the ad money returns are read across all channels from posted entries: a customer acquisition cost of $186.11, blended return on ad spend of 31.31, and blended profit on ad spend of 28.39 over nine months. Return and profit are different questions, and only the second one buys the next production run.

A channel metrics panel covering all channels over nine months: customer acquisition cost of $186.11, blended ROAS of 31.31 and blended POAS of 28.39.

What did the discount cost?

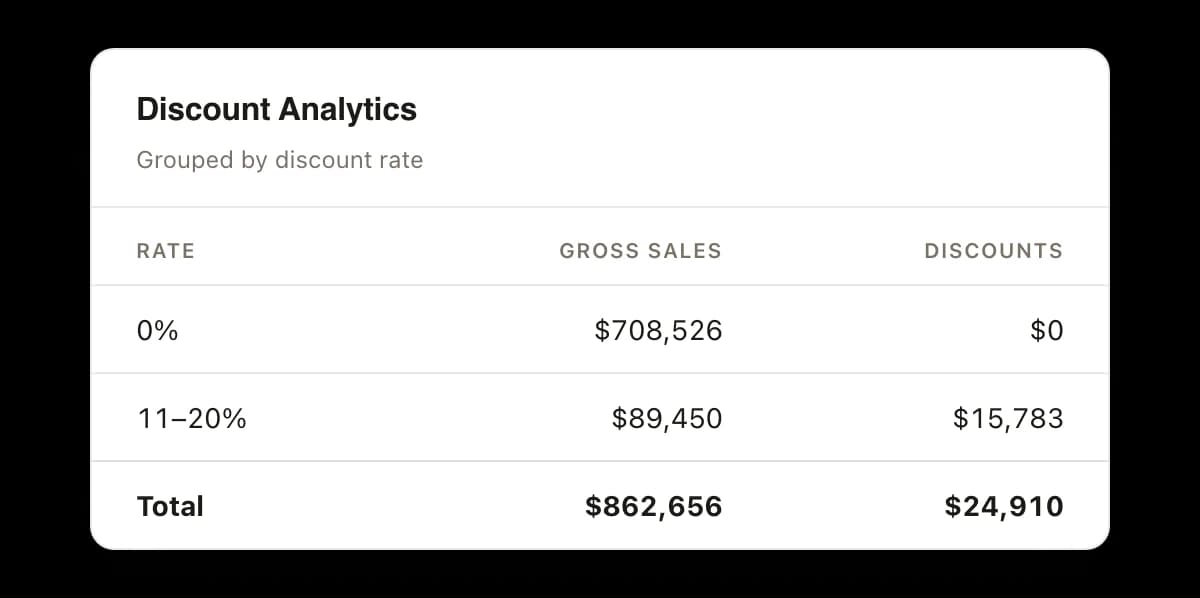
Discounts are booked against the orders that carried them and grouped by rate, so a promotion shows what it gave away and what it brought in. You can see whether the SKUs on offer still earned anything once fees and returns came off them.

A discount analytics panel grouped by discount rate: $708,526 of gross sales sold at no discount giving up $0, $89,450 sold at eleven to twenty percent giving up $15,783, above a total of $862,656 of gross sales and $24,910 of discounts.

Which SKUs keep the margin?

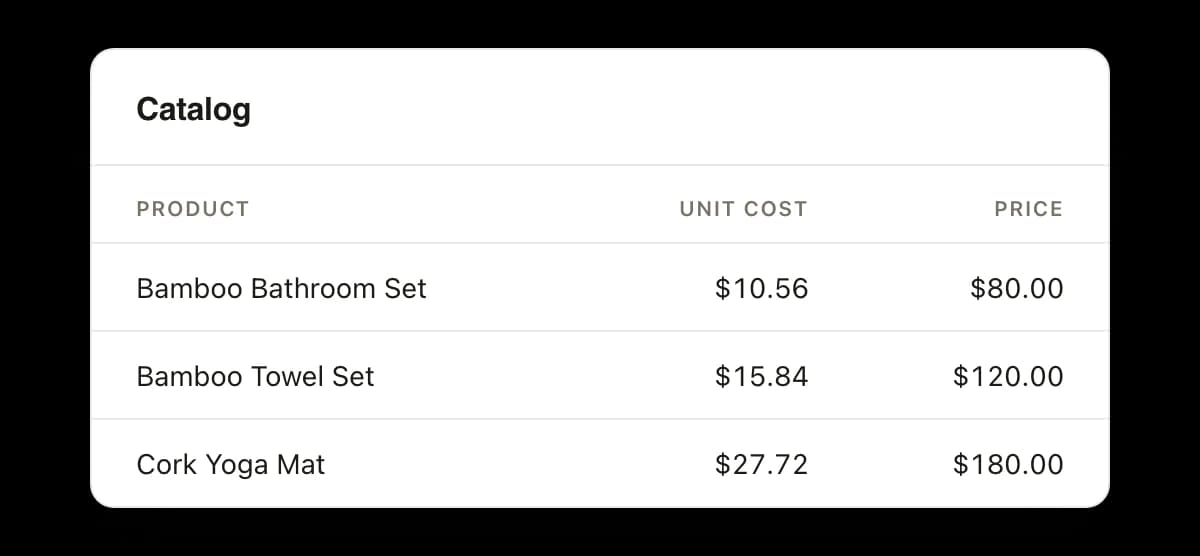
Every product carries its own unit cost against its selling price, then the fees charged on it and the returns against it, so the ranking is by what a SKU keeps rather than by what it sells. The gap between the two columns is where a catalog decision actually gets made.

Three catalog products, each with its unit cost beside its price: the Bamboo Bathroom Set at $10.56 against $80.00, the Bamboo Towel Set at $15.84 against $120.00 and the Cork Yoga Mat at $27.72 against $180.00.

Every number here has an owner.Three lanes, one ledger.

HugoRevOps Analyst

Channel and SKU, ranked

Hugo reports revenue and margin by channel and by SKU after discounts, refunds, fees, and cost of goods, with orders, units, average order value, and refund rate beside them, so a ranking can be acted on the same week.

VicBookkeeper

Every fee, coded as it lands

Vic books referral fees, fulfillment and storage charges, shipping, refunds, and payouts against the orders behind them and closes the period, so when a fee schedule changes the numbers move the same week rather than at quarter end.

MargoFP&A

Where the trend is heading

Margo carries the margin trend forward into the cash forecast, so a SKU that is quietly compressing shows up as a smaller number of weeks ahead rather than a surprise at the close.

Where the revenue came from,and what came off it.

Gross sales walked down to net sales, what discounting gave away along the way, and the unit cost sitting under every SKU.

Gross sales, then net sales

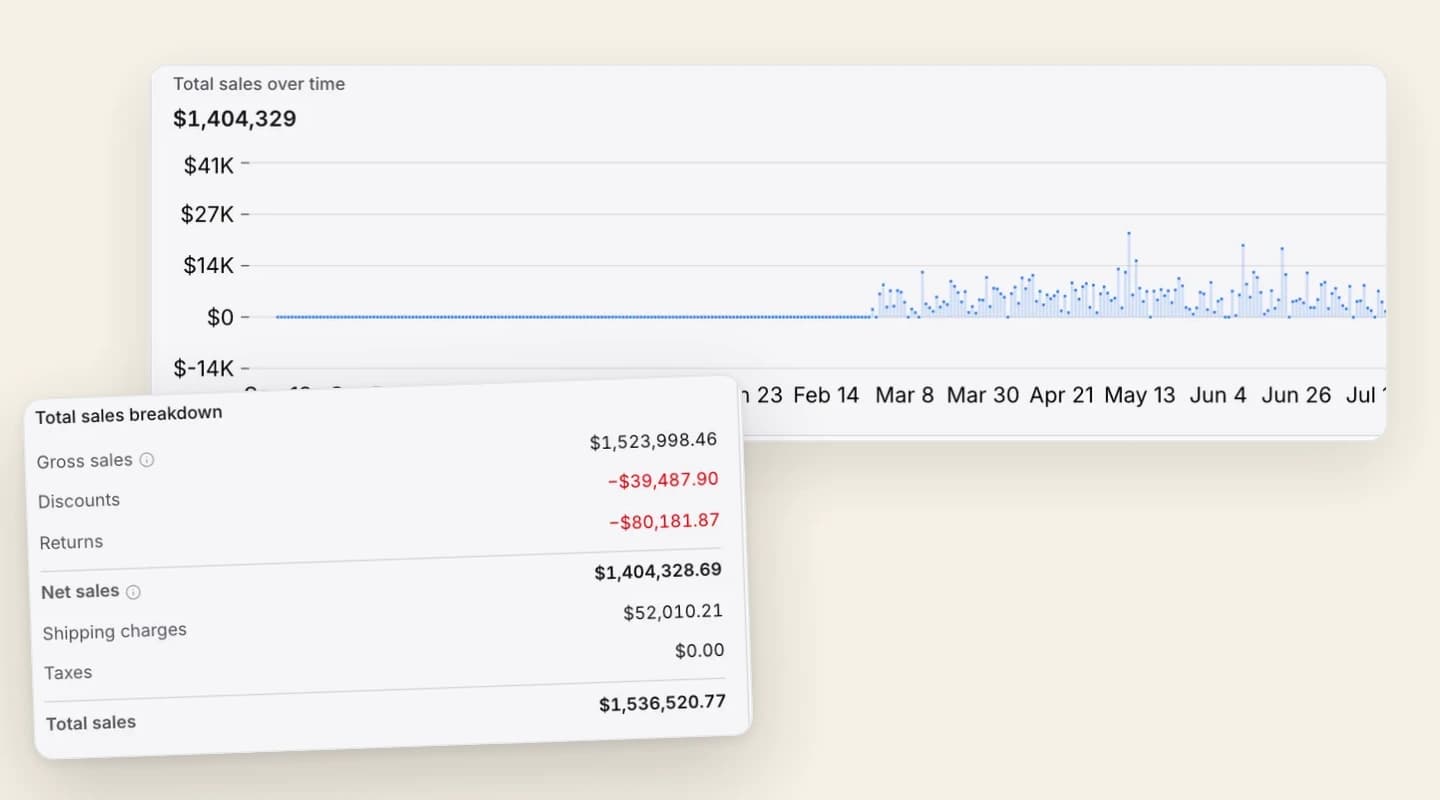
The revenue surface plots sales day by day and breaks the same period down beside the chart: $1,523,998.46 of gross sales, with $39,487.90 of discounts and $80,181.87 of returns taken off to reach $1,404,328.69 of net sales across 567 orders.

A revenue surface: tiles reading $1,523,998 of gross sales, a 39.1 percent returning customer rate, 542 orders fulfilled and 567 orders, over a daily sales chart whose axis runs from September 13th round to August 31st, beside a total sales breakdown listing gross sales of $1,523,998.46, discounts of minus $39,487.90, returns of minus $80,181.87, net sales of $1,404,328.69, shipping charges of $52,010.21 and total sales of $1,536,520.77.

What discounting cost, daily

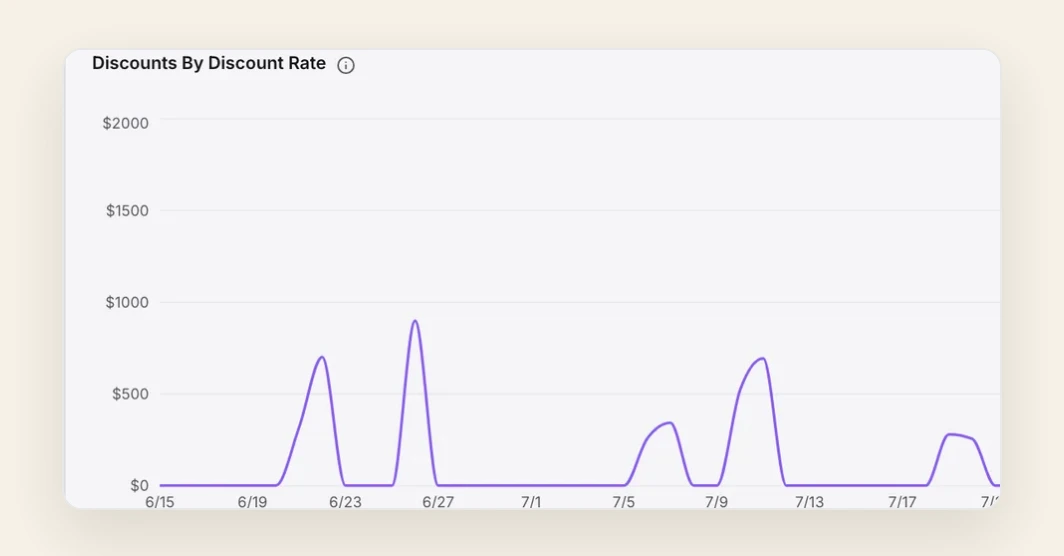
The discount report groups by rate, by code, or by date and plots what was given away each day. Here the 2.9 percent rate is plotted from mid June to mid September, on an axis topping out at $2,000, with a profitability tab beside it.

A discount report on its performance tab, grouped by discount rate, plotting discounts given day by day from June 15th to September 11th on an axis running from $0 to $2,000, with the 2.9 percent rate as the single series and its largest days just under the top of the axis.

Unit cost on every SKU

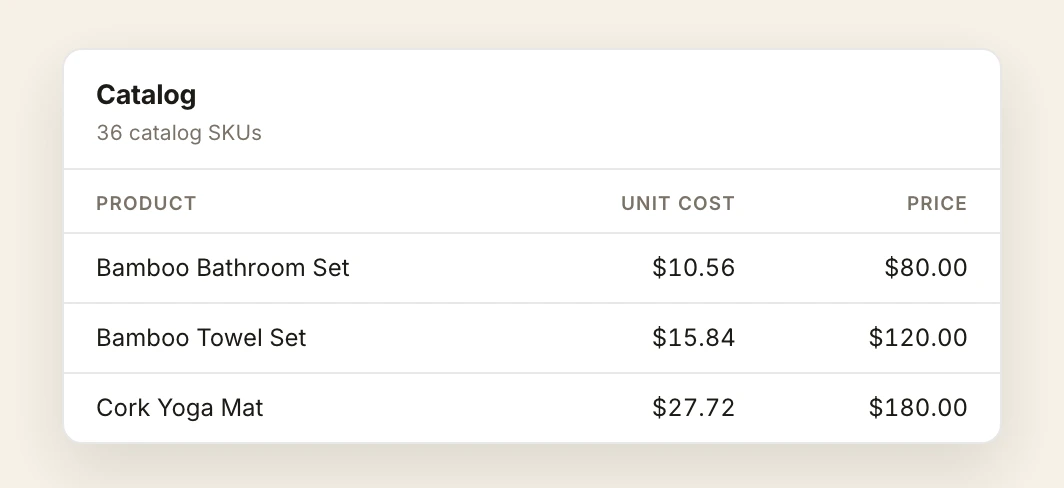
The catalog carries 36 SKUs, each with its own unit cost against its selling price: the Beeswax Candle Trio at $11.88 against $90.00, the Eco Laundry Strips at $4.95 against $38.00, the Eco Soap Bar Set at $7.92 against $60.00. Listing status sits on the same row.

A catalog table of 36 SKUs with columns for product, internal SKU, unit cost, selling price, pack, case pack, status and listing: the Beeswax Candle Trio at $11.88 against $90.00, the Kraft Gift Box Shell at $1.32 against $4.50, the Eco Laundry Strips at $4.95 against $38.00 and the Eco Soap Bar Set at $7.92 against $60.00.

The profit dashboard,and the spreadsheet under it.

What it replaces
A dashboard that estimates margin from the top line
Hugo
RevOps Analyst
What it replaces
Fee and refund tabs rebuilt every settlement
Vic
Bookkeeper
What it replaces
Channel P&L assembled by hand at quarter end
Margo
FP&A

What operators ask about margin,before moving a budget.

Gross sales, discounts, refunds, net revenue, cost of goods, marketplace and fulfillment fees, shipping, average order value, refund rate, and margin, reported by channel, by brand, and by SKU. Ad spend and return on ad spend from your connected ad accounts sit alongside them, with the source of each figure shown.

Yes. Every product carries the revenue it earned, the cost of goods behind it, the fees charged on it, and the returns against it, so products rank by what they keep rather than what they sell. Channels are walked the same way, side by side, from gross sales down to gross profit.

A dashboard reads your channels and estimates. Futureproof is one ledger that replaces your accounting software, so the same posted entries produce both the margin ranking and the financial statements your accountant and a buyer read. There is no second set of numbers to reconcile.

Yes. Discounts are booked against the orders that carried them and grouped by rate, so a promotion shows what it gave away, what it brought in, and whether the products on offer still earned anything after fees and returns.

Amazon and eBay connect directly. Shopify support is in beta, and TikTok Shop is coming soon. Once a channel is connected, its orders, fees, refunds, and payouts post into your books, and the margin reporting builds on those entries.

Your numbers. Your answers. Smarter moves.

Put the budgetbehind the SKUs that earn it.

Connect your channels, your bank, and your suppliers, and margin by channel and by SKU stops being a monthly reconstruction.

Starting at $1,000/month for all six agents, with a monthly review call with a human financial specialist included. No per-seat fees, no modules.

Margin Matters

The platform news, read for your margin

Twice a month: the changes that touch your P&L, the money behind each one, and one move to make. Three minutes, then back to work.

Twice a month. Unsubscribe anytime.