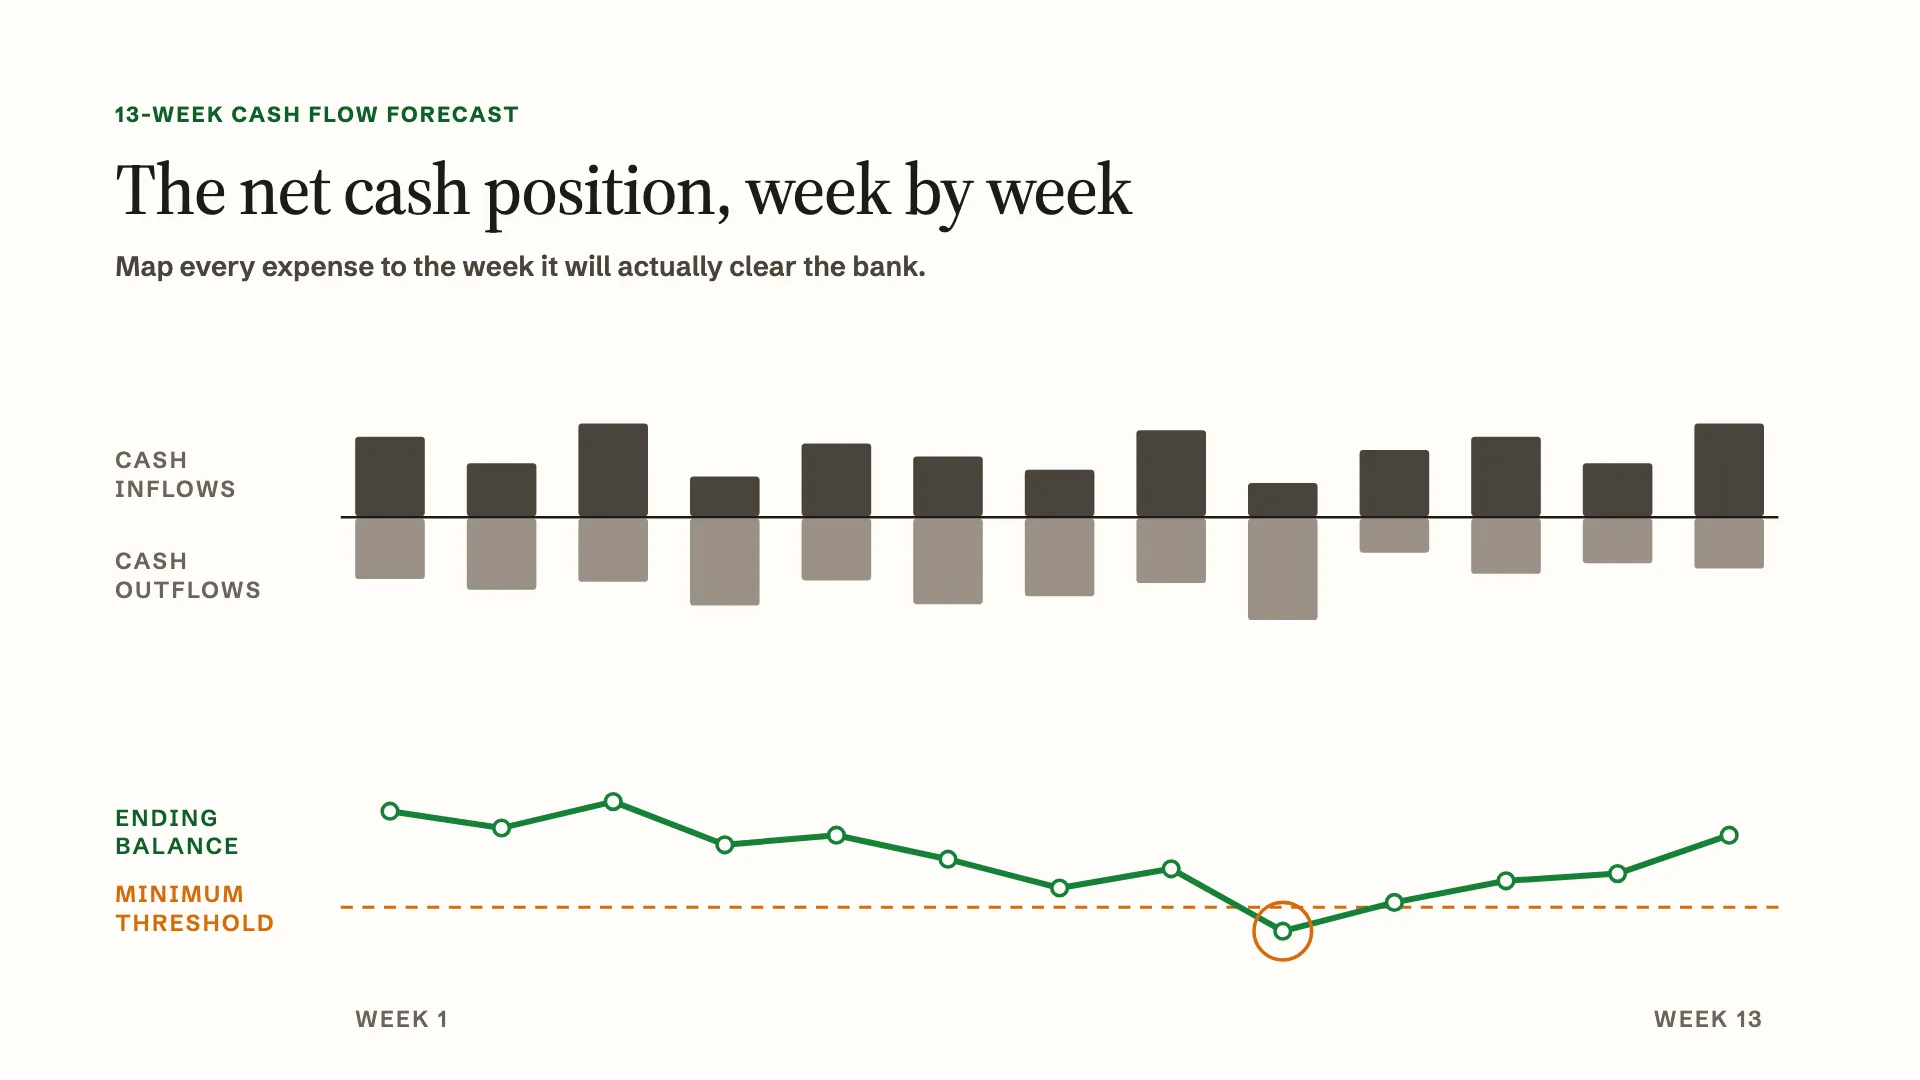



Cash in the bank was $520,000 on Monday, comfortably above the $400,000 floor the leadership team had set. On the same Scorecard, the lowest balance in the 13-week forecast read $310,000, and wholesale invoices more than 15 days past due had been red for three weeks running.
They belong to a luggage and travel bags brand run on EOS. EOS for ecommerce means using the Entrepreneurial Operating System, the management system from the book Traction, in a product business, and the hard part is the numbers: which weekly figures go on the Scorecard, who owns each, and how they feed the quarterly priorities. If a number moves cash this week, it goes on the weekly Scorecard; if it needs a closed month to be right, it goes in the monthly review.
What EOS is, in brief
EOS, the Entrepreneurial Operating System, is the management system described in the book Traction by Gino Wickman and taught by EOS Worldwide, which publishes the system at eosworldwide.com. The Scorecard, Rocks, the Level 10 Meeting and the Accountability Chart are EOS Worldwide's tools and terms. This post is not affiliated with or endorsed by EOS Worldwide, and what follows is our plain summary of what each tool is for, not a quotation of their rules.
- The Accountability Chart shows who is accountable for each area of the company.
- Rocks are the priorities to be finished in a quarter.
- The Scorecard is the set of numbers the leadership team reviews every week.
- The Level 10 Meeting is the weekly leadership meeting where those numbers are reviewed and problems are worked through.
How many numbers, who owns them and how the meeting runs are covered in EOS Worldwide's own material. Everything below, including the number of measurables and the seats, is this post's suggestion for an ecommerce company.
A product business has a particular problem: most of its cash sits in stock, in money the marketplaces have not paid out yet, and in invoices wholesale buyers have not paid. The Scorecard has to show those positions every week, because each of them moves faster than a monthly review can catch.
The example company's weekly Scorecard
An example Scorecard for an ecommerce company: the luggage brand's ten numbers for the week ending Sunday, October 11, 2026, as the leadership team saw them at Tuesday's meeting. The company and every figure are invented, and each goal is a judgment to replace with your own. In practice, keep the last 13 weeks side by side; that is how "red three weeks running" gets noticed.
| Seat | Number | Goal | This week | Status |
|---|---|---|---|---|
| Sales and marketing | Net sales, all channels | $173,000 a week (plan) | $174,000 | On track |
| Sales and marketing | Ad spend against plan | Within 5% of $38,000 | $44,500 (17% over) | Off track |
| Sales and marketing | Contribution after ad spend, all channels | $45,000 | $41,000 | Off track |
| Operations | Stock on hand at cost | Under $1,000,000 | $910,000 (15.2 weeks) | On track |
| Operations | Open purchase commitments still to pay | Under $350,000 | $340,000 | On track |
| Operations | Orders shipped within two business days | 98% | 98.4% | On track |
| Finance | Cash in bank, Monday morning | Above $400,000 | $520,000 | On track |
| Finance | Lowest balance in the 13-week forecast | Above $400,000 | $310,000, week of Dec 14 | Off track |
| Finance | Weeks of cash | At least 3 | 3.1 | On track |
| Finance | Wholesale invoices over 15 days past due | Under $25,000 | $68,000 | Off track |
Ten numbers, three seats, one owner each; ten is our suggestion for a company this size, enough to cover cash, stock and sales without crowding the meeting. Below, each gets a definition, a source, and the reason it is read weekly.
Sales and marketing seat
The head of growth owns these three.
Net sales by channel. Orders and sales after discounts and refunds, split by Shopify, Amazon, eBay and wholesale. It comes from each channel's own reports and the wholesale invoicing system. This week: Shopify $84,000 on 720 orders, Amazon $49,000 on 610, wholesale $36,000 on 11, eBay $5,000 on 95. It is weekly because a channel that slips for three weeks has already cost a month of sales by the time a monthly report shows it.
Ad spend against plan. Dollars spent across every ad account in the week, against the week's budget. It comes from the ad platforms. It is weekly because ad spend is the one large cost the company can change by Wednesday.
Contribution after ad spend, by channel. Net sales, less the landed cost of what sold, channel fees, fulfillment and shipping, and the ad spend that channel ran. It is the profit each channel left to pay the fixed costs, as set out in contribution margin vs gross margin. This week's split, using each product's standard landed cost and last month's fee and fulfillment rates:
| Channel | Net sales | Contribution after ad spend | Share of sales |
|---|---|---|---|
| Shopify | $84,000 | $19,000 | 22.6% |
| Amazon | $49,000 | $9,500 | 19.4% |
| Wholesale | $36,000 | $11,500 | 31.9% |
| eBay | $5,000 | $1,000 | 20.0% |
| Total | $174,000 | $41,000 | 23.6% |
The weekly figure is an estimate. The exact one arrives when the month is closed and the actual fees, freight bills and returns are in. That is acceptable, as long as everyone in the room knows it, because the weekly version exists to catch the direction, and the extra $6,500 of ad spend shows up in it the same week.
Operations seat
The COO owns these three.
Stock on hand at cost. Every unit the company owns, in its 3PL, in Amazon's warehouses and in transit, valued at landed cost (the factory price plus freight and duty). Divided by about $60,000 of cost of goods a week over the last eight weeks, $910,000 is 15.2 weeks, which the team reads as context beside the dollar goal. The Scorecard carries dollars rather than units, because dollars are what the bank feels. The product-by-product version is in weeks of supply. It is weekly because a container arriving or a slow month can move the figure by $100,000 in days.
Open purchase commitments still to pay. Purchase orders placed with suppliers but not yet fully paid: the balance on each order after any deposit, by the date it falls due. It comes from the open purchase orders and the supplier ledger. It is weekly because each new order adds to it the day it is signed, long before anything arrives or shows in the accounts.
Orders shipped within two business days. The 3PL's own report. It is here because a slip in it costs sales and ratings before it costs anything in the accounts, and it is the one operations number on this Scorecard that is not in dollars.
Finance seat
The finance seat is often a fractional CFO or an outside bookkeeper working with the CEO. In this company it is a fractional CFO, two days a week, who owns these four.
Cash in bank against a floor. The balance across operating accounts on Monday morning, against the lowest balance the team has agreed to run at. This company set its floor at nearly two and a half weeks of payments, enough to absorb a late payout and a freight bill landing in the same week.
Lowest balance in the 13-week forecast. The single lowest week in a rolling 13-week cash flow forecast, updated every week with actual receipts and payments. This is the leading number on the whole Scorecard. Cash today was $520,000; the forecast showed the December balance payment for the spring factory order, about $180,000, landing in the same weeks as holiday ad spend, taking the balance to about $310,000.
Weeks of cash. Cash in bank divided by the average weekly amount paid out over the last 13 weeks, stock payments included. At $520,000 and about $168,000 a week, it is 3.1 weeks. It is a blunt number and was on track this week while the forecast was not, which is the point of carrying both: weeks of cash describes today, the forecast low describes the weeks when this company's large payments fall due.
Wholesale invoices over 15 days past due. The total of accounts receivable from wholesale buyers more than 15 days beyond their due date, from the aging report in the invoicing system. It is weekly because a wholesale buyer who starts paying late usually gets later, and every week of delay is a week the company is lending its own cash to a larger company.
Weekly numbers go on the Scorecard; closed-month numbers go in the review
Weekly is about how often a number can be acted on, not whether it predicts. Five rows on this Scorecard move before results do: the forecast low, open purchase commitments, ad spend against plan, past-due wholesale invoices and orders shipped on time. The rest, such as cash in bank and last week's sales, report results already in, and they are read weekly because a slide caught in week two costs less than one caught at month end. Numbers that are only right once the month is closed go in the monthly review.
| Weekly Scorecard | Monthly review (needs a closed month) |
|---|---|
| Cash in bank against the floor | Gross margin by channel and product line |
| Lowest week in the 13-week forecast | Inventory turns and days of inventory |
| Weeks of cash | Aged stock and any write-down |
| Orders, net sales and contribution by channel | Full contribution by channel, with actual fees and returns |
| Ad spend against plan | Cash conversion cycle |
| Stock on hand in dollars | Whether the month's books were closed on time |
| Open purchase commitments still to pay | Profit against the annual plan |
| Wholesale invoices past due |
Gross margin needs the month's cost of goods at landed cost, every freight and duty bill allocated, and any stock that will sell below cost written down in that month. None of that is finished on a Monday. Inventory turns compare a year of cost of goods with average stock, so a single week barely moves them. The cash conversion cycle works the same way. Closing the month's books is the monthly measurable for the finance seat: done by an agreed business day, reconciled to the bank, so that the weekly estimates can be checked against something final. The full monthly set, worked through for an example company, is in inventory KPIs.
Some teams add a monthly section to the Scorecard for these. That works, provided nobody reads a weekly gross margin and acts on it.
When a number goes off track
Four numbers were red. In the weekly meeting each owner flagged their number as off track and the team set them aside as issues to work through after the review. When they did, three of them turned out to be one issue.
What the numbers showed. The forecast low of $310,000 was the issue the others fed. About $41,000 of the $68,000 past due sat with one regional chain. The extra $6,500 a week of ad spend, if it ran through to the December payment, would be about $58,000 over nine weeks.
What was behind them. The chain's buyer had paid on time all year. When the fractional CFO pulled the remittances, the chain had also taken about $9,000 of deductions against earlier invoices that nobody could yet match to anything in its vendor agreement. If the agreement allows them, or the company ends up accepting them to keep the account, they reduce the sale and should have been estimated when the sales were booked. If not, and the company will pursue them, they stay owed, with an allowance if collection is doubtful. Nobody knows yet which, so $9,000 of the $68,000 may never arrive. The ad overspend was Amazon campaigns the head of growth had raised for a launch, and contribution after ad spend had fallen with it.
What the team agreed. Three actions, each with one owner and due within a week:
- The fractional CFO sends the chain's payables team invoice copies and proof of delivery for the $32,000 not in dispute, and asks for the agreement terms behind the $9,000.
- The head of growth gives the launch a fixed budget and end date, the extra $6,500 a week for four more weeks, and brings Amazon spend back to plan from the week of November 9 unless the launch product is selling without ads by then.
- The COO asks the factory to split the December balance into two payments four weeks apart.
Of the nine weeks of extra spend before the December payment, the launch keeps four, so five weeks at $6,500, about $32,500, comes back. With the chain's undisputed $32,000, the forecast low rises from about $310,000 to about $375,000, still $25,000 under the floor, and that assumes the cut loses no sales. The factory split is the third lever, and the factory may refuse it, which is why the forecast low stays on the Scorecard every week until December.
Example Rocks for the finance and operations seats
A Rock is a quarterly priority with a finish line. When a Scorecard number stays red for weeks, the fix often needs a quarter of work rather than a week's action, and it becomes a Rock. Three this company could set for the quarter ending December 31:
| Seat | Rock | Done means |
|---|---|---|
| Finance | The four finance numbers are ready by 10 a.m. every Monday, from accounts reconciled to the bank through the prior Friday. | Eight Mondays in a row with no number missing or late. |
| Finance | Wholesale past due is under $25,000, and every open deduction is matched to a buyer agreement or disputed in writing. | Four weeks under $25,000, and a list of deductions with none unexplained. |
| Operations | The summer factory order is placed on terms that keep the 13-week forecast above the floor in every week. | Signed order and payment schedule, and the forecast run with it, showing no week under $400,000. |
Each Rock ties back to a Scorecard row, which is how finance numbers feed the quarterly plan.
If you cannot produce a number in minutes
A weekly number is only useful if someone can produce it in minutes, on time, every week. Many companies of this size cannot yet. The forecast lives in a spreadsheet one person updates when they have time. Contribution by channel needs fees from settlement reports that arrive on the marketplace's schedule. Stock at cost needs a landed cost for every product. A number that arrives on Thursday, or with three caveats, gets skipped in the meeting, and soon nobody reports it.
What to do first:
- Start with what is exact today. Cash in bank, ad spend, orders and net sales by channel, and wholesale past due can each be read in minutes from a bank login, the ad platforms, the channel reports and the invoicing system's aging report. A Scorecard of those five is honest from week one.
- Make the missing numbers Rocks. "Stock on hand at landed cost, weekly" and "a 13-week forecast updated every Monday" are quarter-sized jobs. Give each to a seat as a Rock, with done meaning the number has appeared on time for several weeks running.
- Label estimates. Weekly contribution will use standard costs and last month's fee rates for some time, perhaps for good. Say so on the Scorecard, and check it against the closed month.
- Get month-end books reliable before trusting the monthly review. If cost of goods is still a percentage of sales until the year-end count, every monthly number above inherits that guess. That is a conversation with your bookkeeper and your CPA, and it usually comes before the weekly numbers can be fully trusted.
Short on time this week, the one finance number to put on the Scorecard is the lowest week in a 13-week forecast. In the example it was the number that turned "we have $520,000" into "we will have $310,000 in December", nine weeks before it arrived.
The test for every row
Go down your current Scorecard and ask of each row whether it moves cash this week or needs a closed month to be right. Cash in bank, the forecast low, stock in dollars, purchase commitments, past-due wholesale and contribution by channel all move this week, so they stay. Gross margin, turns and closing the books need the month, so they go to the monthly review. The example company's Scorecard did not prevent a $310,000 week, but it showed the problem nine weeks before it happened. For the wider set of numbers a brand tracks beyond the Scorecard, see the ecommerce KPI dashboard guide.
FAQ
How is an EOS Scorecard different from a KPI dashboard?
A Scorecard, as this post uses it, is a short list of weekly numbers, each with one owner and a goal, reviewed as on or off track in the weekly leadership meeting. A dashboard can hold dozens of metrics nobody owns. For an ecommerce company, the Scorecard is the handful of dashboard numbers that move cash within the week, with a name next to each, and an off-track number becomes an issue to solve that week.
Who owns the finance numbers on an EOS Scorecard without a full-time CFO?
The person in the finance seat on the Accountability Chart, which in a $2 million to $20 million ecommerce company can be a fractional CFO or an outside bookkeeper. Owning a number means producing it on time and explaining it when it is off track. If the finance seat sits with the CEO for now, give each finance number to whoever can produce it, and make filling the seat a Rock.