Most ecommerce founders can tell you their ROAS. Fewer can tell you what it actually costs to acquire a customer, what that customer is worth over time, or how long it takes to earn back the money spent to win them. These are the three numbers that determine whether a business model works or whether growth is just accelerating the rate at which cash goes out the door.
Customer acquisition cost, lifetime value, and payback period are not vanity metrics. They are the unit economics that tell founders whether spending another dollar on ads creates value or destroys it. For ecommerce businesses, where margins are thinner and cash cycles are longer than in software, getting these numbers right is the difference between scaling profitably and scaling into a cash crisis.
The problem is that most ecommerce sellers have never calculated these metrics properly. The formulas look simple on paper, but the inputs are messier than they appear. Ad spend is scattered across platforms. Revenue per customer varies by channel. Repeat purchase rates differ by product category. And the standard SaaS-oriented guides to CAC and LTV do not account for the realities of selling physical products online.
This guide walks through how to calculate each metric for an ecommerce business, where the standard formulas break down, and how to use the results to make better decisions about growth spending.
Customer Acquisition Cost: What It Really Costs to Win a Buyer
CAC measures the total cost of acquiring a new customer. The basic formula is straightforward:
CAC = Total Acquisition Spending / Number of New Customers Acquired
For a SaaS company with a single marketing channel, this calculation takes five minutes. For an ecommerce business running ads on Meta, Google, TikTok, and Amazon while also investing in email, influencer partnerships, and organic content, it gets complicated fast.
What Belongs in the Numerator
The most common mistake is counting only ad spend. CAC should include every cost directly tied to acquiring new customers:
- Paid advertising. Meta, Google Shopping, TikTok Ads, Amazon PPC, Pinterest, and any other paid channel. Include the full spend, not just the amount attributed to conversions.
- Influencer and affiliate costs. Flat fees, commissions, and the cost of product sent for review or promotion.
- Discounts and promotions. First-order discount codes, free shipping offers on first purchases, and welcome offer subsidies. If a 20% discount is the primary mechanism for converting new buyers, that margin hit is part of acquisition cost.
- Creative and content production. Photography, video production, and copywriting costs for acquisition-focused campaigns.
- Software and tools. The portion of ad management, attribution, and analytics tools used for acquisition. Proportional allocation is fine.
- Team costs. Salaries or contractor fees for team members focused on acquisition marketing. If a founder spends 40% of their time on growth marketing, 40% of their effective compensation belongs here.
Leaving out any of these costs understates CAC and makes the business model look healthier than it is.
What Belongs in the Denominator
The denominator should count only genuinely new customers, not repeat purchasers. This is where many ecommerce brands get the number wrong. A returning customer who places their fourth order is not a new acquisition, even if they clicked a retargeting ad to get there.
Separating new from returning customers requires clean data. Most ecommerce platforms can distinguish first-time from repeat orders. If the data is not clean, start by deduplicating customer email addresses against order history. Imperfect but directionally accurate data is better than blending new and returning customers into a single number.
Channel-Level CAC
Blended CAC, total acquisition spend divided by total new customers, is useful as a summary metric. But it hides the performance differences between channels. A business with a $25 blended CAC might be acquiring customers at $12 on Google Shopping and $55 on TikTok. Without channel-level visibility, founders cannot make informed allocation decisions.
Calculate CAC for each channel by attributing both the costs and the new customers to the channel that drove the acquisition. Attribution is imperfect, especially in a multi-touch environment, but last-click attribution by channel is a reasonable starting point for most ecommerce businesses under $10M in revenue.
Ecommerce CAC Benchmarks
CAC varies enormously by product category, price point, and competitive intensity. A few directional benchmarks for context:
| Category | Typical CAC Range |
|---|---|
| Consumables and replenishables | $10–$35 |
| Apparel and accessories | $20–$60 |
| Home goods and furniture | $40–$120 |
| Health and wellness supplements | $25–$75 |
| Electronics and gadgets | $30–$80 |
These ranges assume a direct-to-consumer model with paid acquisition as the primary channel. Marketplace-only sellers (Amazon, Walmart) often have lower explicit CAC but higher platform fee loads that function as an embedded acquisition cost.
Lifetime Value: What a Customer Is Actually Worth
LTV measures the total revenue (or profit) a business can expect from a single customer over the entire relationship. If CAC tells founders what they paid to acquire a customer, LTV tells them what they got in return.
The basic formula:
LTV = Average Order Value × Purchase Frequency × Customer Lifespan
Each of these inputs requires careful measurement for ecommerce businesses.
Average Order Value
Average order value (AOV) is total revenue divided by total number of orders over a given period. Use at least 12 months of data to smooth out seasonal spikes. For businesses with wide product assortments, AOV can vary significantly by channel or product category. A customer acquired through a $15 impulse-buy ad has a different AOV trajectory than one who entered through a $200 furniture purchase.
For a more accurate LTV calculation, segment AOV by acquisition channel or product category rather than using a single blended number.
Purchase Frequency
Purchase frequency is the average number of orders a customer places per year. This is where ecommerce LTV calculations diverge most sharply from SaaS. A SaaS customer pays monthly by default. An ecommerce customer might buy once and never return, or might reorder every six weeks for three years.
Calculate purchase frequency by dividing total orders by unique customers over a defined period. Use at least 24 months of data if available, because many ecommerce categories have long repurchase cycles. A skincare brand might see a 60-day repurchase cycle. A furniture brand might see one purchase every three years.
For businesses with less than two years of operating history, use cohort data from the earliest customers to estimate frequency. Track how many of the customers acquired in month one placed a second order within 3, 6, and 12 months.
Customer Lifespan
Customer lifespan is the average duration of the customer relationship, measured in years. This is the hardest input to measure accurately for ecommerce, because there is no explicit cancellation event. Unlike SaaS, where a customer churns by canceling a subscription, an ecommerce customer simply stops ordering.
A practical approach: define "churned" as any customer who has not placed an order in a period equal to two times the average purchase cycle. If the average repurchase interval is 90 days, a customer who has not ordered in 180 days is likely churned. Use this threshold to estimate average lifespan from historical cohort data.
Revenue LTV vs. Profit LTV
The formula above produces revenue-based LTV. This is a starting point, but it overstates the actual value of a customer because it ignores costs. A customer who generates $500 in lifetime revenue but costs $350 in COGS, fulfillment, and platform fees is worth $150 in gross profit, not $500.
Profit-based LTV = AOV × Gross Margin % × Purchase Frequency × Customer Lifespan
Where gross margin accounts for product cost, shipping, platform fees, and fulfillment. This version of LTV is what should be compared against CAC.
Cohort-Based LTV
The strongest LTV analysis tracks actual customer cohorts over time rather than relying on averages. Group customers by the month they were acquired, then track cumulative revenue (or profit) from each cohort at 3, 6, 12, 18, and 24 months. This reveals whether newer cohorts behave differently from older ones and whether LTV is trending up or down.
Cohort analysis also exposes acquisition quality differences. Customers acquired during a Black Friday promotion may have a lower LTV than those acquired through organic search, even if both groups had the same first-order value.
The LTV:CAC Ratio: Is the Model Working?
The LTV:CAC ratio answers the most fundamental question in unit economics: does the business earn back more than it spends to acquire each customer?
LTV:CAC Ratio = Lifetime Value / Customer Acquisition Cost
General benchmarks:
| Ratio | Interpretation |
|---|---|
| Below 1:1 | Losing money on every customer. Not sustainable. |
| 1:1 to 2:1 | Breaking even or marginally profitable per customer. Growth spending is risky. |
| 3:1 | Healthy. Earning $3 for every $1 spent on acquisition. |
| Above 5:1 | May be underinvesting in growth. There is room to spend more aggressively. |
A 3:1 ratio using profit-based LTV is the standard target for ecommerce businesses. But the ratio alone does not tell the full story. A 3:1 ratio means nothing if it takes 18 months to earn back the acquisition cost and the business runs out of cash at month six.
That is where payback period comes in.
Payback Period: How Long Until Acquisition Spend Comes Back
Payback period measures how many months it takes for a customer's cumulative gross profit to equal the cost of acquiring them. It is the time dimension that LTV:CAC ignores.
CAC Payback Period = CAC / (Average Monthly Gross Profit per Customer)
Where average monthly gross profit per customer equals:
(AOV × Gross Margin %) × (Purchase Frequency / 12)
Why Payback Period Matters More for Ecommerce Than SaaS
In SaaS, payback period is important but somewhat academic. Recurring subscriptions generate predictable monthly revenue, and the customer either stays or cancels. The cash flow pattern is smooth.
In ecommerce, payback period is a cash flow constraint. Acquisition spending happens upfront. Revenue comes back in lumps (whenever the customer places another order), and each order carries variable costs that eat into the return. A 12-month payback period means the business needs 12 months of working capital to fund every cohort of new customers before those customers become profitable.
For a business spending $50,000 per month on acquisition with a 10-month payback period, that is $500,000 in working capital tied up in customers who have not yet paid back their acquisition cost. This is why many fast-growing ecommerce businesses feel cash-strapped despite strong top-line growth and healthy LTV:CAC ratios. The math works on a spreadsheet, but the cash is not there yet.
Payback Period Benchmarks for Ecommerce
| Payback Period | Assessment |
|---|---|
| Under 3 months | Excellent. Aggressive growth spending is likely warranted. |
| 3–6 months | Healthy. Standard for businesses with strong repeat purchase rates. |
| 6–12 months | Manageable but requires careful cash flow planning. |
| Over 12 months | Risky without significant capital reserves or financing. |
Ecommerce businesses should generally target payback periods under six months. Beyond that, the cash flow strain of funding acquisition becomes a growth bottleneck, especially for bootstrapped or lightly funded brands.
Where the Standard Formulas Break Down for Ecommerce
The formulas above are clean and logical. Real ecommerce data is neither. Here are the places where the standard calculations mislead founders if they are not adjusted.
Marketplace Sellers Have Hidden Acquisition Costs
Amazon sellers often believe their CAC is zero because they do not run external ads. But Amazon PPC is an acquisition cost. So is the referral fee premium on competitive categories. And the organic ranking that drives "free" traffic was built through years of review acquisition, listing optimization, and promotional pricing, all of which have costs.
For marketplace sellers, a more honest CAC calculation includes Amazon PPC spend plus the referral fee and FBA fee premium above what a direct sale would cost. This blended marketplace CAC is often higher than founders expect.
Multi-Channel Attribution Is Messy
A customer might see a TikTok ad, search for the brand on Google, click an organic result, and then buy through Amazon. Which channel gets credit for the acquisition? The answer matters because it determines channel-level CAC, which drives budget allocation.
Perfect attribution does not exist. For most ecommerce brands, the practical approach is to pick a consistent attribution model (last click is the simplest), apply it uniformly, and make decisions based on directional trends rather than precise numbers. A 20% margin of error on channel-level CAC is acceptable if the alternative is no channel-level visibility at all.
LTV Projections Are Unreliable for Young Businesses
A business with six months of data cannot reliably estimate a three-year customer lifespan. The temptation is to project early repeat purchase behavior forward, but this overestimates LTV because the customers most likely to repurchase do so early. The long tail of the cohort churns silently.
For businesses with limited history, use a conservative LTV estimate based only on observed data. If six months of cohort data shows that 30% of customers make a second purchase and 10% make a third, use those numbers rather than projecting a curve. As more data accumulates, the estimates can be revised upward.
Seasonal Distortion
Ecommerce metrics swing with the calendar. CAC spikes during Q4 when ad costs increase. AOV jumps during gift-giving season but may not reflect the customer's ongoing behavior. Repeat purchase rates look artificially low in Q1 because Q4 buyers were gift givers who never intended to buy again.
Calculate all three metrics using full-year data whenever possible. Quarter-by-quarter tracking is useful for identifying trends, but avoid making structural decisions based on a single season's numbers.
Putting It All Together: A Practical Example
Consider an ecommerce brand selling premium pet supplies:
| Input | Value |
|---|---|
| Monthly acquisition spend | $30,000 |
| New customers per month | 600 |
| Average order value | $65 |
| Gross margin (after COGS, shipping, fees) | 45% |
| Purchase frequency | 3.5 orders per year |
| Customer lifespan | 2.2 years |
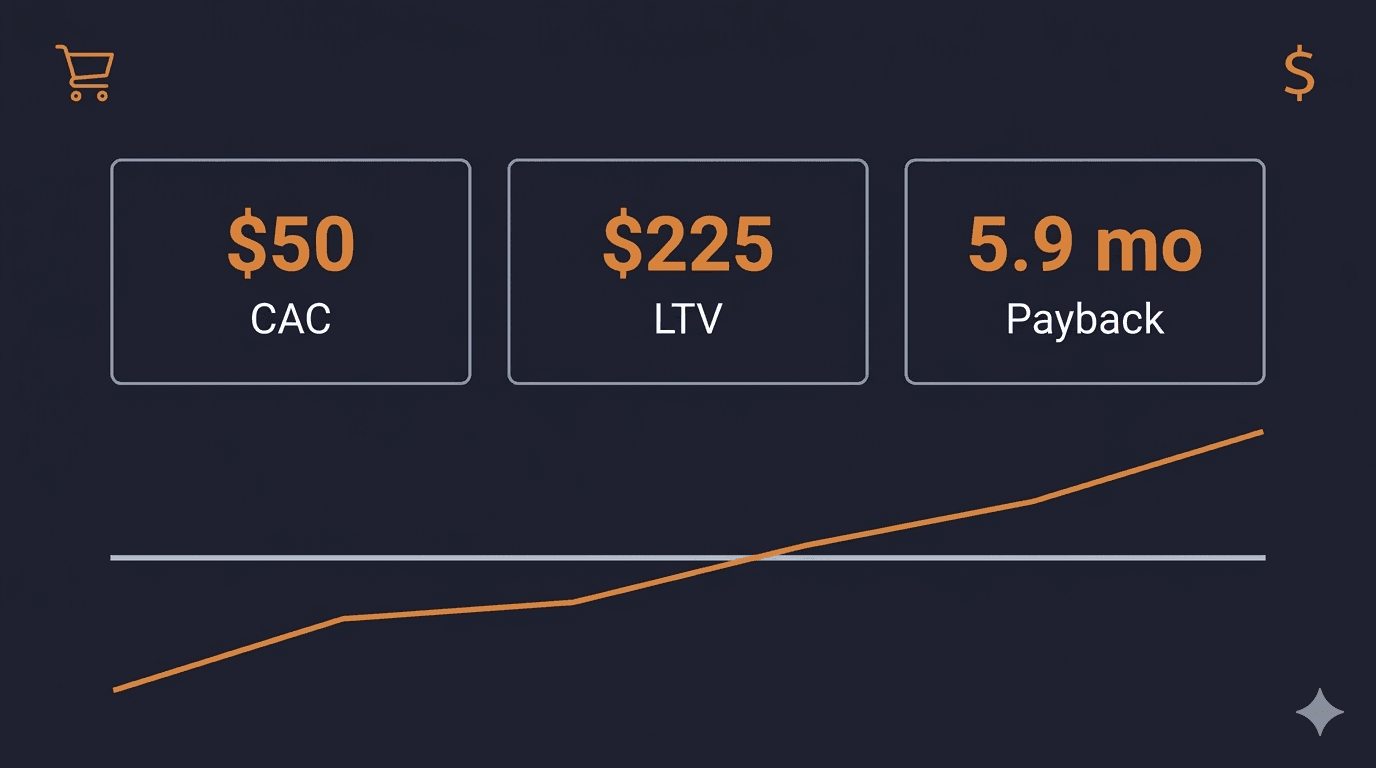
CAC = $30,000 / 600 = $50
Revenue LTV = $65 × 3.5 × 2.2 = $500.50
Profit LTV = $65 × 0.45 × 3.5 × 2.2 = $225.23
LTV:CAC Ratio = $225.23 / $50 = 4.5:1 (healthy)
Monthly gross profit per customer = ($65 × 0.45) × (3.5 / 12) = $8.53
Payback period = $50 / $8.53 = 5.9 months (acceptable)
This business has strong unit economics. The 4.5:1 LTV:CAC ratio justifies increased acquisition spending, and the six-month payback period means cash is recycled fast enough to fund growth without external capital. The question for this founder is whether they are spending enough, not whether they are spending too much.
Now change one variable. Drop gross margin to 30% (maybe shipping costs increased, or the brand started discounting more heavily):
Profit LTV = $65 × 0.30 × 3.5 × 2.2 = $150.15
LTV:CAC Ratio = $150.15 / $50 = 3.0:1 (still acceptable, but less room for error)
Monthly gross profit per customer = ($65 × 0.30) × (3.5 / 12) = $5.69
Payback period = $50 / $5.69 = 8.8 months (getting tight)
A 15-point margin compression turned a comfortably profitable growth engine into a business that needs nearly nine months to recoup acquisition costs. This is why product profitability analysis at the SKU level matters. Margin erosion on even one high-volume product can quietly destroy unit economics across the entire catalog. At $30,000 per month in acquisition spend, that is $264,000 in outstanding payback at any given time. For a bootstrapped brand, that number determines whether growth is sustainable or whether the founder is funding customer acquisition out of personal savings.
From Periodic Calculation to Continuous Visibility
Most ecommerce founders who calculate CAC, LTV, and payback period do it once, usually during fundraising prep or an annual planning exercise. The numbers go into a pitch deck or a spreadsheet, and then the business moves on.
The problem is that these metrics shift constantly. Ad costs change weekly. Gross margins fluctuate with shipping rates, supplier pricing, and platform fee adjustments. Repeat purchase behavior evolves as the product assortment grows. A quarterly recalculation might catch a major shift. A monthly review is better. Real-time tracking is what actually lets founders make decisions before small changes become big problems.
For a dashboard-level view of how these metrics combine with channel profitability and inventory efficiency, see our guide to ecommerce KPIs and the financial dashboard you actually need.
The shift from periodic calculation to continuous visibility is the difference between knowing unit economics as a concept and using unit economics as a decision-making tool. When CAC, LTV, and payback period are always current, founders can answer questions that matter: Can we afford to increase ad spend this month? Is this new channel acquiring profitable customers or just cheap ones? Should we invest in retention or keep pushing acquisition?
Futureproof connects ecommerce financial data, including ad spend, revenue, COGS, and fees, into a single view so founders can track unit economics alongside cash flow in real time. No more quarterly spreadsheet exercises. No more guessing whether the growth math still works. Join the Futureproof ecommerce waitlist and know your real unit economics, not just your ROAS.