

Seller content has a house style for wins. A tactic gets a case-study bullet: added $6,700 in sales in two weeks, doubled sessions in a month, moved a keyword from page three to page one. The dollar figure attached is always sales added. The figure that never appears is how much of that money the seller kept.
The omission matters because on a marketplace, sales dollars and profit dollars are different currencies with an unfavorable exchange rate. Between the sale and the bank account sit referral fees, fulfillment fees, and the advertising that produced the lift in the first place. Each takes its cut before a founder sees a cent of gross profit.
So there is a question worth asking of every tactic, and it is the one seller culture almost never asks: after fees, fulfillment, and the ad spend that drove it, what did this actually add to gross profit? Most founders of brands in the $5M to $50M range cannot answer it, not because the math is hard, but because no one in the building has a reconciled view of profit across channels. The math below shows why the answer is smaller than most sellers expect, and why the lever that survives the math is not the one the scoreboard celebrates.
How much of an added sales dollar does a seller keep?
Take the $6,700 win and walk it through the waterfall. Assume a typical mid-weight private-label product: a $30 average selling price, which makes $6,700 roughly 223 units, standard-size FBA fulfillment, landed cost of goods at 30 percent of price, and a 20 percent total advertising cost of sales (TACoS) on the campaign that produced the lift. None of these assumptions is rigged; each sits near the middle of the range for this kind of product.
Here is where the $6,700 goes:
- Amazon's referral fee takes 15 percent of the $6,700, which is $1,005.
- FBA fulfillment at $5.50 per unit across 223 units takes $1,227.
- The advertising that drove the lift, at 20 percent TACoS, takes $1,340.
- Landed cost of goods at 30 percent of price takes $2,010.
What remains is roughly $1,118 of gross profit. That is about 17 cents of every sales dollar. The $6,700 headline was never false; it was measuring revenue, and revenue is the input, not the result. Seeing this number per SKU and per channel, rather than once a year in a panic, is the working definition of ecommerce accounting.
Sellers often ask how much Amazon takes from a sale. In this example the platform's direct fees, referral plus fulfillment, took 33 cents of every dollar, and the advertising required to win the placement took another 20. What the marketplace takes is only part of the story; what the growth itself costs is the rest. Our ecommerce fee calculators run this waterfall for a specific product and channel.
The waterfall also changes shape on every channel a brand sells through. The same product on Shopify carries no referral fee but pays for its own fulfillment and faces a different advertising market; Walmart and TikTok Shop each apply their own commission and fulfillment structures. A tactic that keeps 17 cents on the dollar on Amazon might keep 25 on Shopify or 12 on TikTok Shop. Sellers who evaluate wins one channel at a time, using each platform's own dashboard, are reading four different scoreboards that were each designed by the party taking the fees.
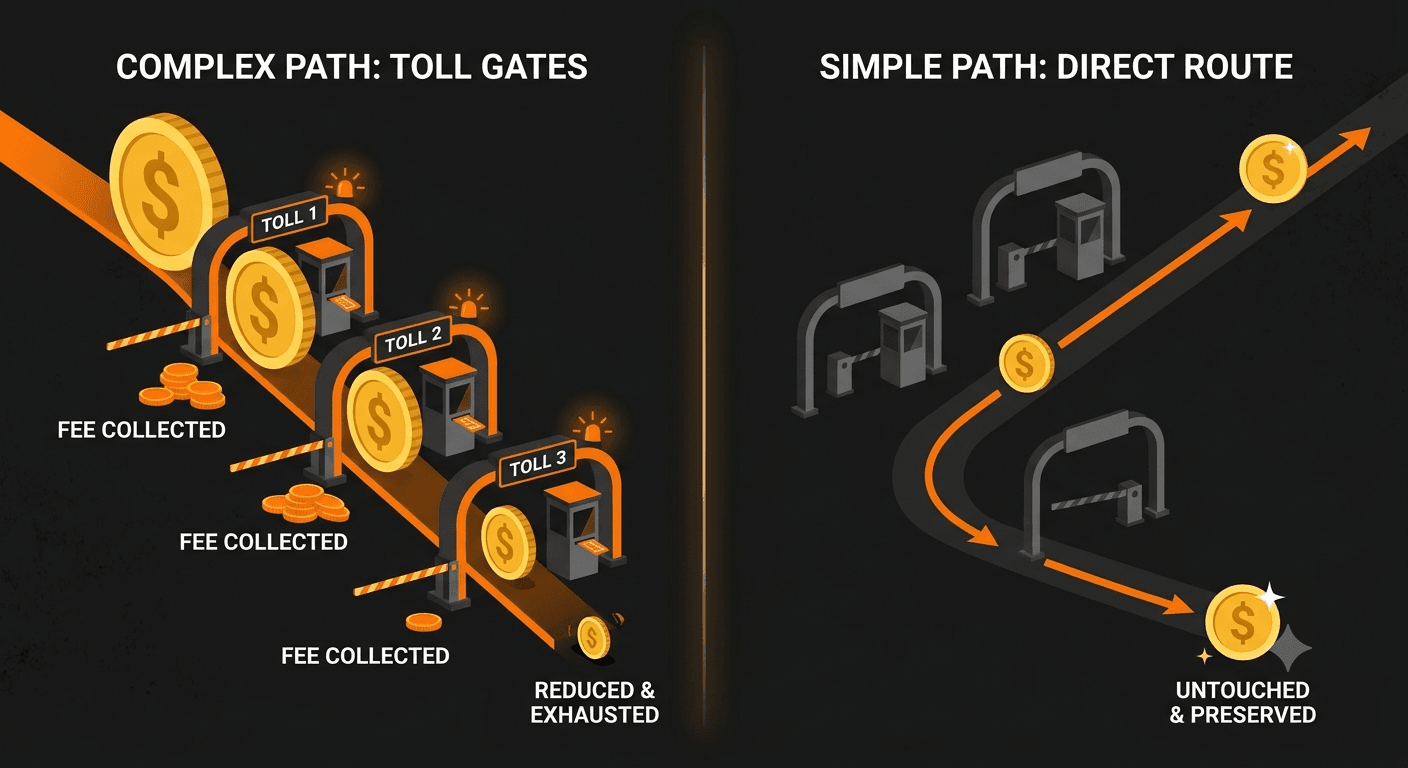
None of this makes fees a villain. They are the toll for access to demand, and sellers who study the fee schedule closely can claw back real points (we cover that in our guide to Amazon's fee stack). But clawbacks do not change the structure. Every added sales dollar passes through the full stack before anything lands in gross margin, and the stack is priced by someone else.
Why a cost reduction skips the fee stack
Now run the comparison the scoreboard never shows. Same product, selling 5,000 units per year. The founder spends a quarter on unglamorous work: consolidating freight, correcting a duty classification, renegotiating supplier terms. The result is a $0.50 per-unit reduction in landed cost.
That is $2,500 added directly to gross profit. No referral fee applies to it. No fulfillment fee applies to it. No ad spend was required to produce it. The reduction passes through the entire fee stack untouched and repeats on every unit for as long as the cost stays down.
To net that same $2,500 through added sales at 17 cents per dollar, a seller would need roughly $15,000 in new revenue. That is the real exchange rate between the two levers: $15,000 of top-line effort, or fifty cents of cost precision, for the same gross profit.
The strategic difference runs deeper than the arithmetic. Jeff Bezos's line "your margin is my opportunity" is usually quoted as a threat, but it is more useful read as a mechanism. Margin that shows up in visible prices, visible placement, and visible ad activity invites competition, because competitors can see it and copy it within days. A cost advantage is invisible. Nobody can scrape a seller's freight consolidation or supplier payment terms. We have written before about why a dollar saved beats a dollar earned in operating terms; on a marketplace, the case is stronger still, because the saved dollar is also the defensible one.
Yet seller culture trains founders to obsess over the lever they least control (traffic, rank, and placement, all of which the marketplace can reprice or reshuffle at will) and to ignore the lever they fully control, which is the per-unit landed cost of every SKU in the catalog.
AI shopping is the same pattern with new vocabulary
The same misallocation is now repeating in the race for AI visibility. Sellers are chasing LLM citations and placement in AI-generated shopping recommendations the way they once chased page-one rank: effort aimed at a surface whose rules they cannot see and whose outcomes they cannot reliably hold.
As shopping agents compress discovery and price comparison, placement advantages will be arbitraged away faster, not slower. What stays inside the seller's control is what was always there: per-unit cost precision. A brand that knows its true landed cost on the container that actually shipped can price with confidence in an agent-mediated market. A brand optimizing placement it cannot hold is renting its advantage.
The question to ask of every tactic
Every tactic, tool, and campaign a brand considers should face the same test: what did it add to gross profit after fees, fulfillment, and the ad spend that drove it? Sales added is the wrong scoreboard. Profit kept is the right one, and it is harder to read, which is exactly why so few sellers read it.
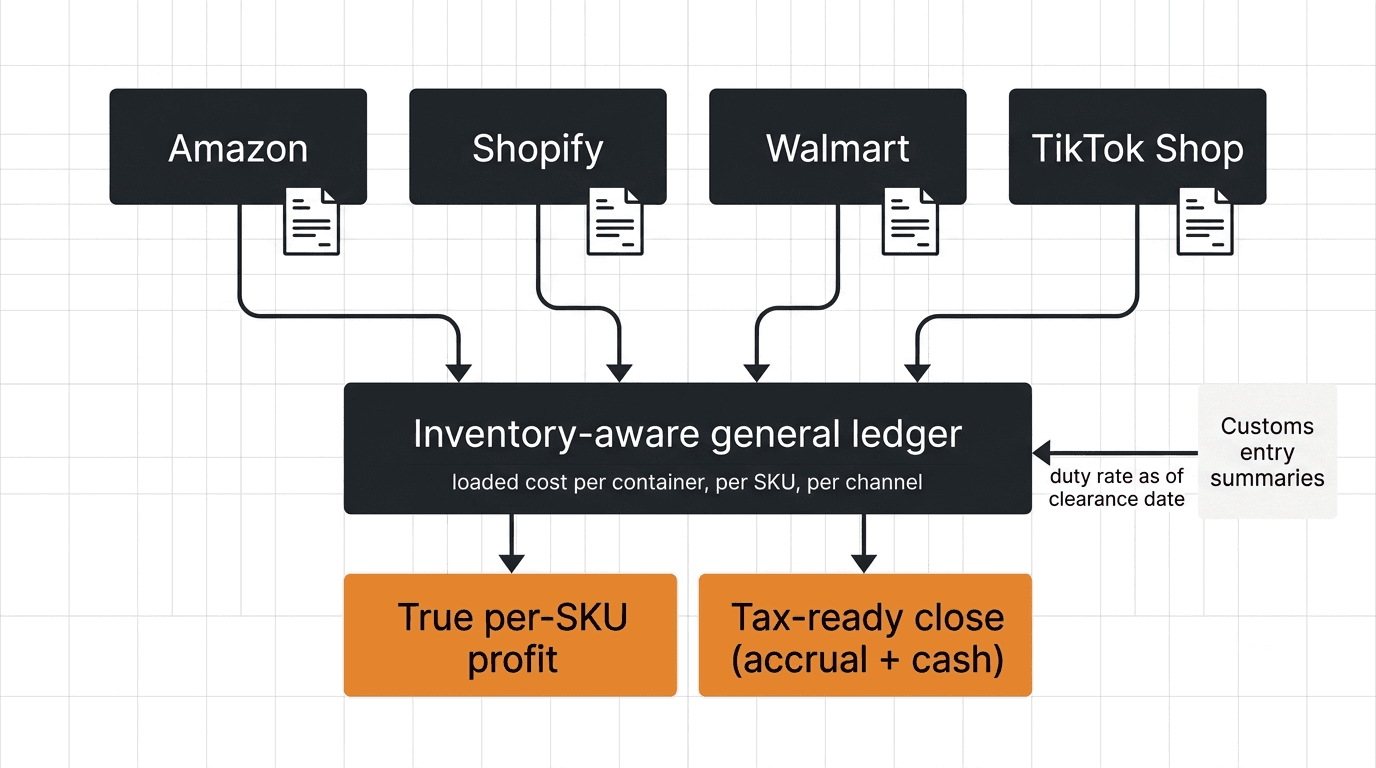
Answering the question requires numbers most brands do not have in one place: a reconciled general ledger across every channel, true blended COGS, per-unit landed cost, and a channel-level P&L that attributes fees and ad spend to the units that incurred them. That discipline is what turns contribution margin from a guess into a working decision tool.
It is also the work Futureproof's AI finance team does for multichannel brands: six agents that keep the ledger reconciled across Amazon, Shopify, Walmart, and TikTok Shop and report profit kept, not just sales added. Amazon and eBay integrations are fully live, with Shopify in beta; founders who want a reconciled, blended P&L can start your 14-day trial. And for founders ready to work the cost side of the ledger, our full guide to true landed cost and per-SKU profit for importing brands shows how to compute the number and keep it current between containers.