


A chart of accounts is the numbered list of categories every transaction in your general ledger gets filed under: assets, liabilities, equity, revenue, and expenses, each with its own account. For a SaaS company, a well-designed chart of accounts is what makes gross margin, deferred revenue, and department spend readable straight from the books instead of reconstructed in spreadsheets.
Most founders inherit whatever default their first accounting tool shipped with, built for a generic small business, and discover the cost two years later when an investor asks for GAAP-ish gross margin and the answer requires forensic work. Designing the chart for SaaS from the start costs an afternoon. This guide gives you the starter structure and the reasoning, so you know what to keep when your situation differs.
What makes a SaaS chart of accounts different?
Three things a generic small-business chart gets wrong for SaaS:
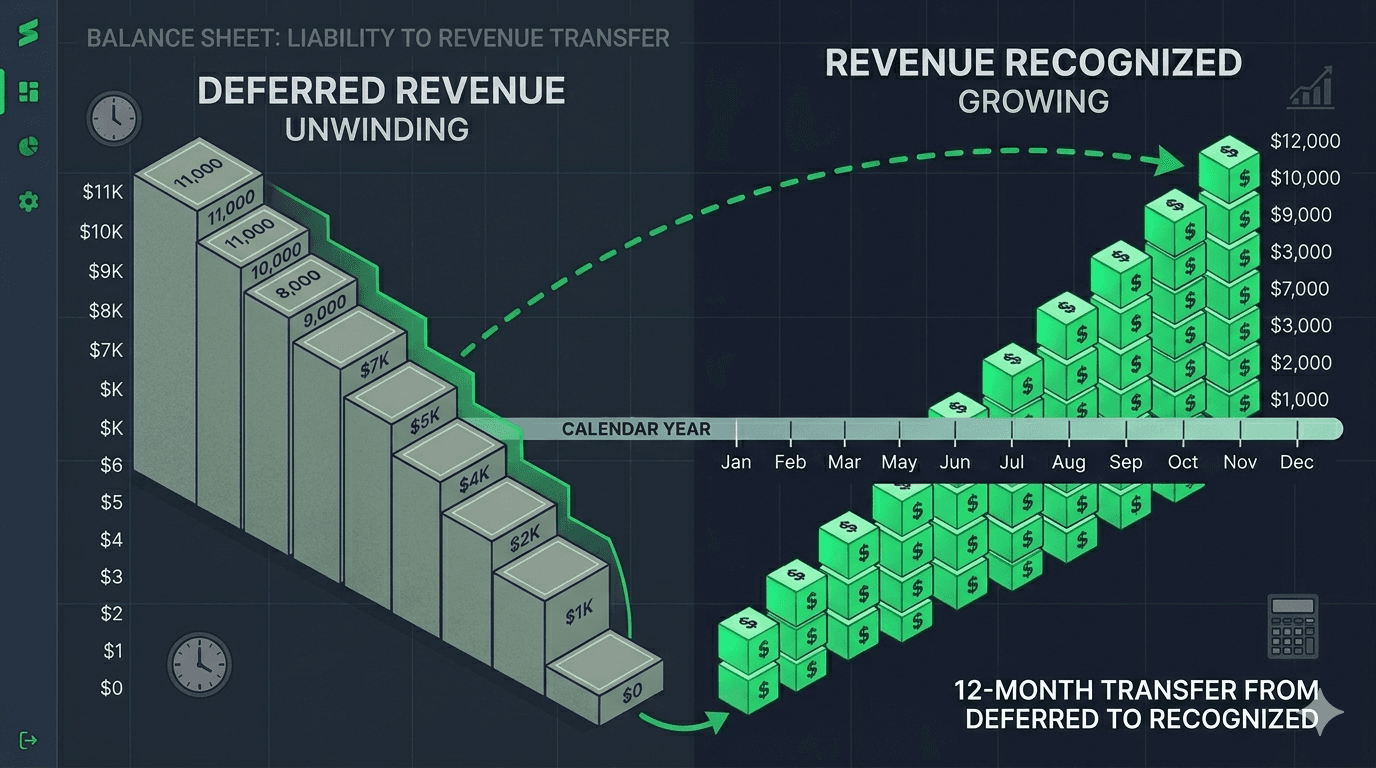
Deferred revenue is a first-class liability. SaaS collects cash before earning it. Without a dedicated deferred revenue account and the discipline to use it, revenue is overstated the month you invoice and understated every month after, which breaks accrual books entirely. Our deferred revenue guide covers the mechanics.
COGS means something specific. SaaS cost of revenue is hosting, third-party services that serve customers, and support, not inventory. Getting the COGS boundary right is what makes your gross margin comparable to the 70 to 80 percent benchmarks investors carry in their heads.
Operating expenses split by function. R&D, sales and marketing, and G&A need to be separable, because that split drives every SaaS efficiency metric investors compute, from magic number to burn quality. A chart that lumps salaries into one account cannot answer "what percent of spend is R&D" without archaeology.
What does the starter template look like?
Numbering follows the standard convention: 1000s assets, 2000s liabilities, 3000s equity, 4000s revenue, 5000s cost of revenue, 6000s operating expenses.
| Number | Account | Notes |
|---|---|---|
| 1010 | Cash - Operating | One per bank account |
| 1200 | Accounts Receivable | Ties to the AR subledger |
| 1400 | Prepaid Expenses | Annual software, insurance |
| 1500 | Fixed Assets | Computers, equipment |
| 1510 | Accumulated Depreciation | Contra-asset against 1500 |
| 2010 | Accounts Payable | Ties to the AP subledger |
| 2100 | Credit Cards Payable | One per card program |
| 2200 | Accrued Liabilities | Expenses incurred, not yet billed |
| 2250 | Sales Tax Payable | Collected where your product is taxable |
| 2300 | Payroll Liabilities | Withholdings, accrued wages |
| 2400 | Deferred Revenue | The SaaS-critical account |
| 2600 | SAFE Notes / Convertible Instruments | Liability vs equity classification is a known trap; get your CPA's read |
| 3010 | Common Stock | |
| 3200 | Additional Paid-In Capital | Where fundraise proceeds land |
| 3300 | Retained Earnings / Accumulated Deficit | Cumulative results roll here at year-end |
| 4010 | Subscription Revenue | The recurring core |
| 4100 | Professional Services Revenue | Implementation, onboarding |
| 4900 | Other Revenue | Keep small and honest |
| 4950 | Interest Income | Treasury yield; other income, never ARR |
| 5010 | Hosting & Infrastructure | AWS, GCP, and the like |
| 5100 | Third-Party Services (COGS) | APIs and tools serving customers |
| 5200 | Customer Support | Support salaries and tooling |
| 6100–6199 | Research & Development | Salaries, contractors, dev tools |
| 6200–6299 | Sales & Marketing | Salaries, ads, events, CRM |
| 6300–6399 | General & Administrative | Rent, legal, insurance, finance |
| 6400 | Stock-Based Compensation | Non-cash; keep it separable for reporting |
Two deliberate omissions. There is no "Miscellaneous" account, because misc is where meaning goes to die. And there are no department-per-account entries like "6110 R&D - Backend Team"; departments belong in a segment or tag dimension, not baked into account numbers, or the chart triples every reorg.
What mistakes make a chart of accounts painful later?
- Too many accounts. Fifty is workable; three hundred is a filing system nobody follows consistently, which makes every report subtly wrong. Add accounts when a real reporting question demands one.
- Mixing COGS into opex. Hosting buried in G&A flatters no one; it just makes gross margin unanswerable.
- Skipping deferred revenue. The single most common SaaS bookkeeping failure, and the one that surfaces at the worst time: revenue recognition review during diligence.
- One revenue account for everything. Subscription and services revenue grow differently and carry different margins; investors want them separable from day one.
- Renumbering casually. Historical comparability dies when accounts get reshuffled. Design once, extend carefully.
How should you actually set this up?
If you are on a generic tool, recreate the structure above and resist its urge to seed forty accounts you will never use. The fuller setup context lives in our accounting for startups guide and the bookkeeping for startups hub.
If the books run on an AI finance team, the chart comes with the system: Futureproof ships a standard SaaS-aware chart of accounts, customizable per company, and its agents file every transaction against it from day one, so the categorization discipline the chart depends on is enforced by the software rather than by willpower. That is ultimately the point of a good chart: it is only as useful as the consistency of what gets filed into it.
FAQ
What is a chart of accounts? The numbered list of every account your ledger files transactions under: assets, liabilities, equity, revenue, and expenses. It defines the vocabulary of your financial reports.
How many accounts should a startup's chart have? Roughly 40 to 80 covers most SaaS startups through Series A, and a clean pre-seed company can run well under 40. The count matters less than the discipline; hundreds of accounts means the chart has stopped being followed.
What accounts does a SaaS company need that others don't? Deferred revenue as a dedicated liability, a subscription vs services revenue split, and a COGS section built from hosting, customer-serving third-party services, and support.
Should departments be separate accounts? No. Keep functions (R&D, S&M, G&A) as account ranges and use segments or tags for teams and departments, so reorgs do not require rebuilding the chart.
The bottom line
A chart of accounts is a small design decision with a long tail: it determines whether gross margin, deferred revenue, and functional spend are facts you read or projects you run. Design it for SaaS in an afternoon, keep it disciplined, and every report downstream gets simpler.
Start a 14-day trial of Futureproof, no credit card required, and get a SaaS-ready chart of accounts with agents that actually keep it consistent.