


Return on capital for an ecommerce brand is the profit an order or SKU earns per dollar of cash tied up in it, expressed per year. Divide the profit from one cycle by the cash the cycle locks in stock, then multiply by the number of cycles in a year. Fund an order only when that return is higher than what the money costs.
It is part of our complete guide to ecommerce accounting.
Most operators know their margin. Fewer know what that margin earns on the cash it takes to produce it. A 30 percent margin on stock that sits for nine months can earn less than a 15 percent margin on stock that sells in six weeks. This guide gives the operator's version of the formula, shows how turns and payback feed it, and sets out the go/no-go rule for funding a purchase order.
What is return on capital, in one line?
Return on capital is profit earned per dollar tied up, per year.
Corporate finance uses several versions. Return on invested capital divides after-tax operating profit by the debt and equity in the whole company. Return on capital employed divides operating profit by total assets minus current liabilities. Both answer a company-wide question about the past year.
An operator deciding whether to place a $40,000 order needs the same idea at a smaller scale and looking forward: if this cash goes into this stock, what does it earn, and how fast does it come back?
The return on capital formula for an operator
Per purchase order, in plain text:
Return per cycle = contribution profit from the order ÷ cash tied up in the order
Cycles per year = 365 ÷ days the cash is tied up
Annual return on capital = return per cycle × cycles per year
Per SKU, over a year:
Annual return on capital per SKU = annual contribution profit of the SKU ÷ average cash tied up in that SKU (stock on hand at landed cost, plus deposits paid and stock in transit)
Three definitions keep the number honest.
Contribution profit is revenue minus landed cost, channel and payment fees, fulfilment, returns and the ad spend attributable to the SKU. It is the per-SKU figure our product profitability analysis builds, and it is closer to contribution margin than to gross margin.
Cash tied up starts on the day the supplier deposit leaves the bank, not the day the stock arrives. Deposits, the balance payment, freight and duties all count.
Days tied up runs from the deposit to the payout that clears the last unit. That span is the order's version of the cash conversion cycle: production, freight, sell-through and the payout lag from each channel.
Why turns multiply the return
The formula has two levers: profit per cycle and cycles per year. Margin moves the first. Turns move the second, and operators tend to underweight it.
Take one illustrative $40,000 order that earns $12,000 of contribution profit each time it sells through. That is 30 percent per cycle.
- If the cash comes back in about 90 days, the order can cycle about four times a year. Annual return on capital: 30 percent × (365 ÷ 90) = about 122 percent.
- If the cash comes back in about 180 days, it cycles about twice. Annual return on capital: 30 percent × (365 ÷ 180) = about 61 percent.
Same product, same margin, half the return. Selling twice as fast is worth as much as doubling the margin, and it is often easier to achieve. Our inventory turnover benchmarks show typical turns by category, and the same section on GMROI there makes the margin-times-turns point from the retail side.
The go/no-go rule: return on capital above cost of capital
Fund an order only when its annual return on capital is higher than the annual cost of the money that pays for it.
The cost of capital is the effective annual rate of the funding, every fee included, or the opportunity cost of your own cash if you pay from the bank account. Compare the two numbers on the same basis: the same order, the same days, the same capital.
The gap between them is your margin of safety. An order earning 60 percent funded at 15 percent has room for a slow month or a price cut. An order earning 60 percent funded at 50 percent does not. A small slip in sell-through will push it under water, because slower sales lower the return and, for interest-bearing debt, raise the dollars paid.
The rule also works in dollars per cycle, which is often easier to explain to a partner: contribution profit from the order minus the funding cost for the days the cash is out. If the result is negative, the order destroys value even when every unit sells.
How payback period and inventory turns feed the number
Two familiar metrics sit inside the return on capital formula.
Payback period is the number of days until the cash coming back from an order equals the cash that went out. It is the break-even point inside one cycle. Everything after payback is profit, and the sooner payback arrives, the sooner the same dollars can fund the next order. Our guide to CAC, LTV and payback period for ecommerce applies the same logic to acquisition spend; here it applies to stock. A long payback period on an order lowers cycles per year directly.
Inventory turns count how many times stock sells through in a year. Turns of 4 imply about 91 days of inventory, and turns of 2 about 183. Add production lead time before the stock arrives and the payout lag after it sells, and you have the days the cash is tied up. Turns set the middle of that span; supplier terms and payout schedules set the ends.
The practical point: a better supplier deposit schedule or a faster payout can raise return on capital without changing price, cost or demand.
Worked example: one purchase order, two margins, two speeds, two funding costs
All numbers are illustrative. Assumptions: a $40,000 purchase order; contribution profit per cycle of $12,000 (higher margin) or $6,000 (thinner margin); cash tied up for 90 days (fast) or 180 days (slow); funding at an effective annual rate of 15 percent (a line of credit) or 50 percent (a factor-rate advance), both derived with the method in our cost of capital post. For a like-for-like comparison, the funding cost here is charged on the full $40,000 for the full cycle.
| Scenario | Annual return on capital | Funding cost per cycle at 15% | Profit after funding at 15% | Funding cost per cycle at 50% | Profit after funding at 50% |
|---|---|---|---|---|---|
| Higher margin, fast (90 days) | about 122% | $1,479 | $10,521 | $4,932 | $7,068 |
| Higher margin, slow (180 days) | about 61% | $2,959 | $9,041 | $9,863 | $2,137 |
| Thinner margin, fast (90 days) | about 61% | $1,479 | $4,521 | $4,932 | $1,068 |
| Thinner margin, slow (180 days) | about 30% | $2,959 | $3,041 | $9,863 | −$3,863 |
Reading the table:
- At 15 percent, every scenario clears the rule. The cheap money can carry a slow, thin order.
- At 50 percent, three scenarios clear it, two of them by very little. Higher margin with slow sell-through keeps $2,137 of a $12,000 profit. Thinner margin with fast sell-through keeps $1,068.
- The thinner, slower order fails outright. It returns about 30 percent against a 50 percent cost, and loses $3,863 per cycle even though every unit sells.
The same order can be a sound decision or a loss depending only on how it is funded and how fast it sells. That is why the funding decision belongs after the return calculation, not before it. Our guide to ecommerce financing options maps which instruments fit which purpose once the numbers are in.
Where the return on capital number lies
The formula is simple. The inputs are where it goes wrong.
Unallocated landed cost. Freight, duties, inspection and inbound fees that sit in a general expense account instead of on the unit cost overstate profit per order. The true landed cost per SKU has to be in the numerator, or every return looks better than it is.
Returns and refunds. A SKU with a high return rate loses revenue, pays fees twice and sometimes loses the unit. Use net revenue after returns.
Ad spend left out of SKU profit. If a product only sells with paid support, that spend belongs in its contribution profit. Leaving it in a blended marketing line flatters the products that need the most help.
A denominator that starts too late. Counting capital from the day stock arrives ignores weeks or months of deposits and freight. Starting the clock at the deposit can cut a calculated return noticeably on long lead-time products.
Blended averages. A catalog-wide return hides SKUs that earn well below the cost of capital. Calculate per SKU, then per order.
How Futureproof shows the inputs
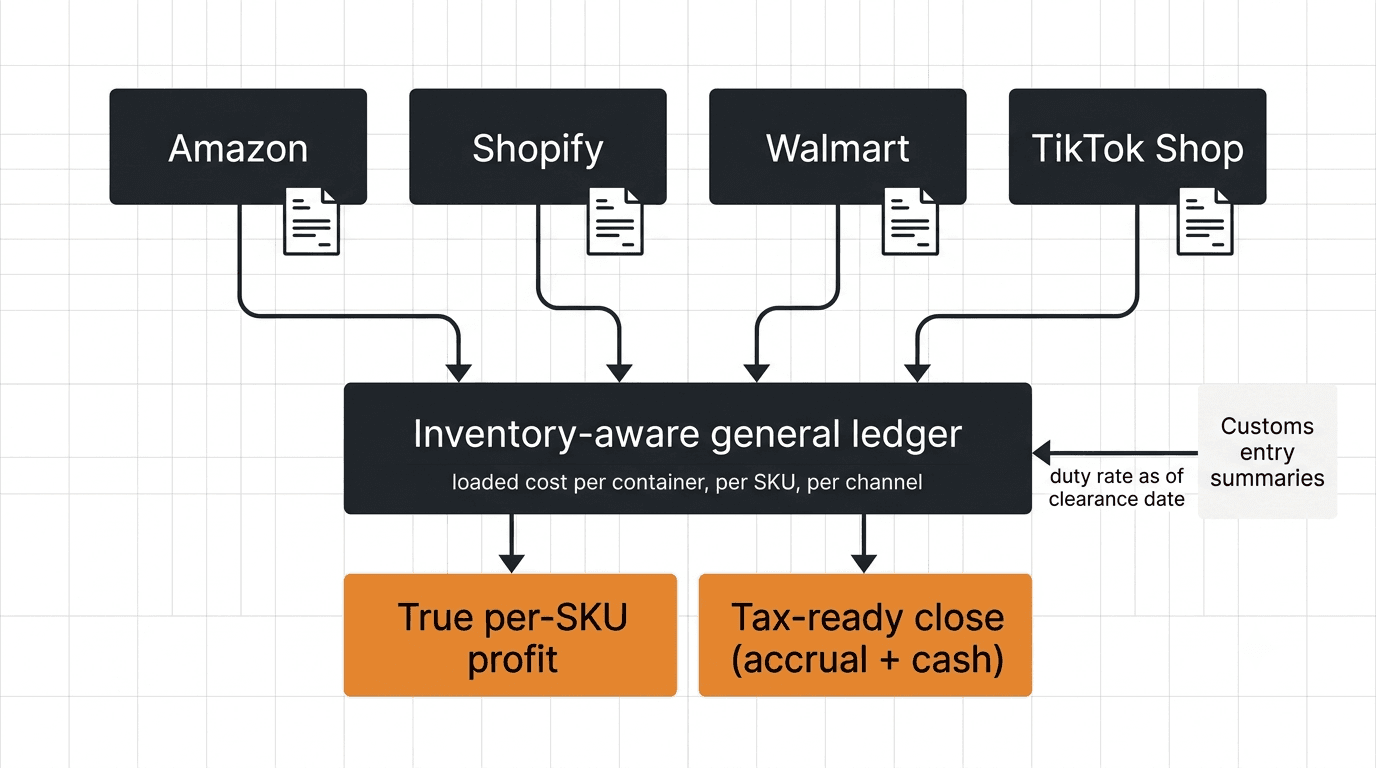
Futureproof never lends and never moves money. It keeps the inputs to this calculation current. Six AI agents work one ledger: payouts reconciled, landed cost allocated per unit, margin by channel and by SKU. Hugo values stock on hand at cost, tracks how fast each SKU sells and reports the cash tied up per SKU. Margo prices a production run against your projected balance on each payment date and says how many units that cash covers, so you see what you can afford next. What to order stays your call. Amazon and eBay are live, and Shopify is in beta.
Start a 14-day trial or book a demo to see per-SKU profit and the cash behind each order from your own books. Plans start at $1,000/month for all six agents.
FAQ
What is a good return on capital for an ecommerce business?
A good return on capital is one that is clearly above your cost of capital, with room left for a slow month. We do not quote a universal benchmark because the right level depends on your funding cost, category turns and margin. Calculate it per SKU and per order, compare it with the effective annual rate of the money funding that order, and treat a thin gap as a warning.
What is the difference between return on capital and return of capital?
Return of capital is getting your original money back. Return on capital is the profit earned on top of it. When a $40,000 order sells through and $52,000 comes back, $40,000 is return of capital and $12,000 is return on capital. Only the second is profit.
How do inventory turns affect return on capital?
Turns set how many times a year the same cash can earn a profit. At the same margin, an order that sells through four times a year earns roughly twice the annual return of one that sells through twice. Faster turns also shorten the time you pay for borrowed money, so they lower funding cost per cycle as well.
Should I borrow to buy inventory if my margin is thin?
Only if the order still clears the rule: its annual return on capital, with landed cost, returns and ad spend included, must be higher than the effective annual rate of the borrowing. Thin margins can work with fast sell-through and low-cost money. Thin margins with slow sell-through and expensive money usually lose, even when every unit sells.